On this page
Debugging
Deno supports the V8 Inspector Protocol used by Chrome, Edge and Node.js. This makes it possible to debug Deno programs using Chrome DevTools or other clients that support the protocol (for example VSCode).
To activate debugging capabilities run Deno with one of the following flags:
--inspect--inspect-wait--inspect-brk
--inspect Jump to heading
Using the --inspect flag will start your program with an inspector server
which allows client connections from tools that support the V8 Inspector
Protocol, for example Chrome DevTools.
Visit chrome://inspect in a Chromium derived browser to connect Deno to the
inspector server. This allows you to inspect your code, add breakpoints, and
step through your code.
deno run --inspect your_script.ts
If you use the --inspect flag, the code will start executing immediately. If
your program is short, you might not have enough time to connect the debugger
before the program finishes execution.
In such cases, try running with --inspect-wait or --inspect-brk flag
instead, or add a timeout at the end of your code.
--inspect-wait Jump to heading
The --inspect-wait flag will wait for a debugger to connect before executing
your code.
deno run --inspect-wait your_script.ts
--inspect-brk Jump to heading
The --inspect-brk flag will wait for a debugger to connect before executing
your code and then put a breakpoint in your program as soon as you connect,
allowing you to add additional breakpoints or evaluate expressions before
resuming execution.
This is the most commonly used inspect flag. JetBrains and VSCode IDEs use this flag by default.
deno run --inspect-brk your_script.ts
Example with Chrome DevTools Jump to heading
Let's try debugging a program using Chrome Devtools. For this, we'll use @std/http/file-server, a static file server.
Use the --inspect-brk flag to break execution on the first line:
$ deno run --inspect-brk -RN jsr:@std/http/file-server
Debugger listening on ws://127.0.0.1:9229/ws/1e82c406-85a9-44ab-86b6-7341583480b1
...
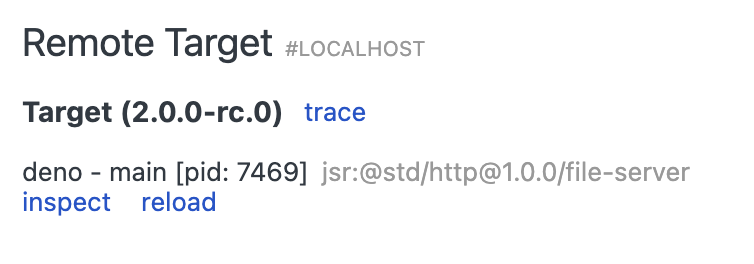
In a Chromium derived browser such as Google Chrome or Microsoft Edge, open
chrome://inspect and click Inspect next to target:
It might take a few seconds after opening the DevTools to load all modules.
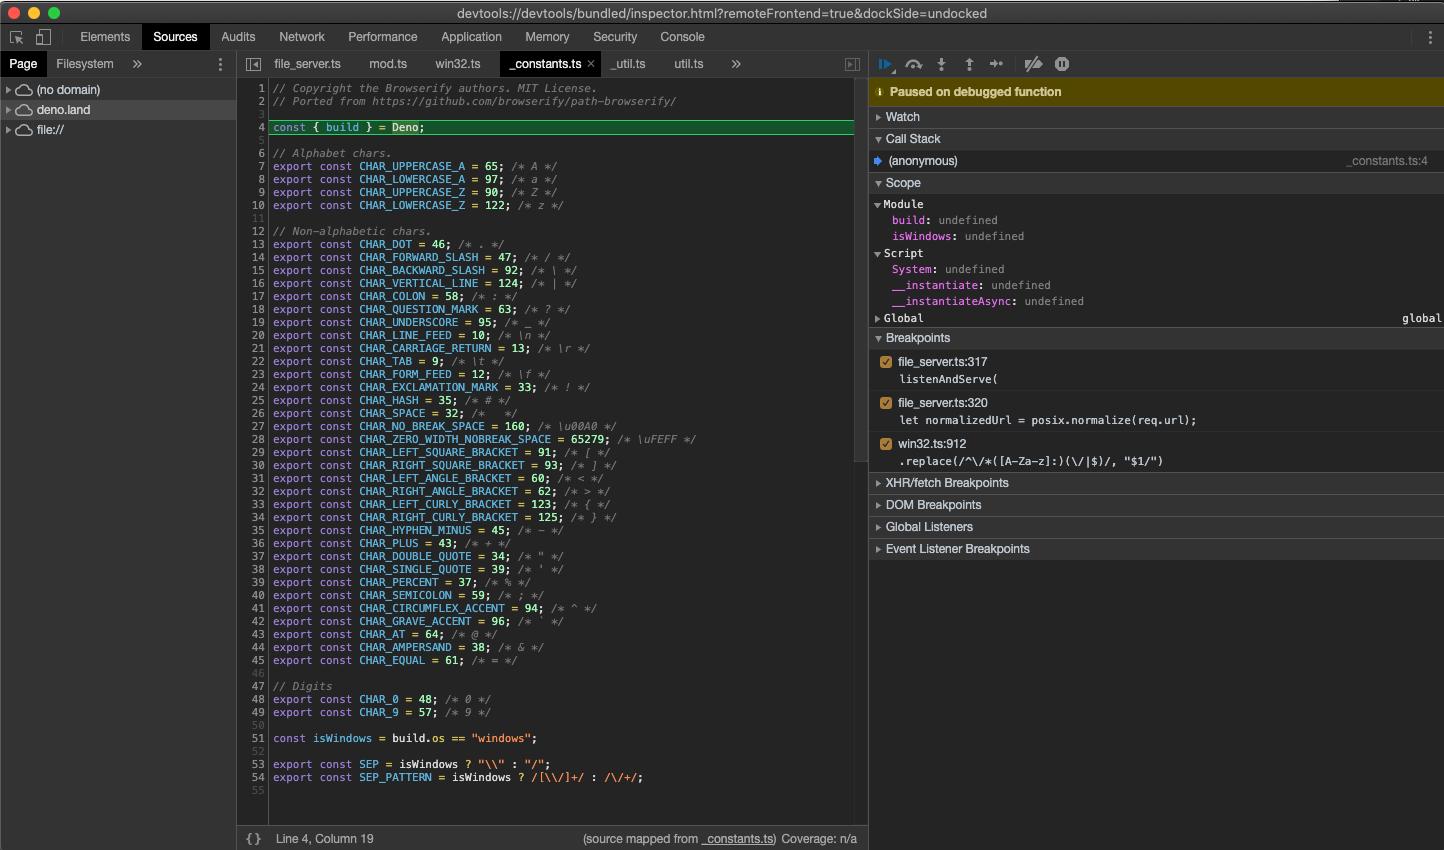
You might notice that DevTools pauses execution on the first line of
_constants.ts instead of file_server.ts. This is expected behavior caused by
the way ES modules are evaluated in JavaScript (_constants.ts is left-most,
bottom-most dependency of file_server.ts so it is evaluated first).
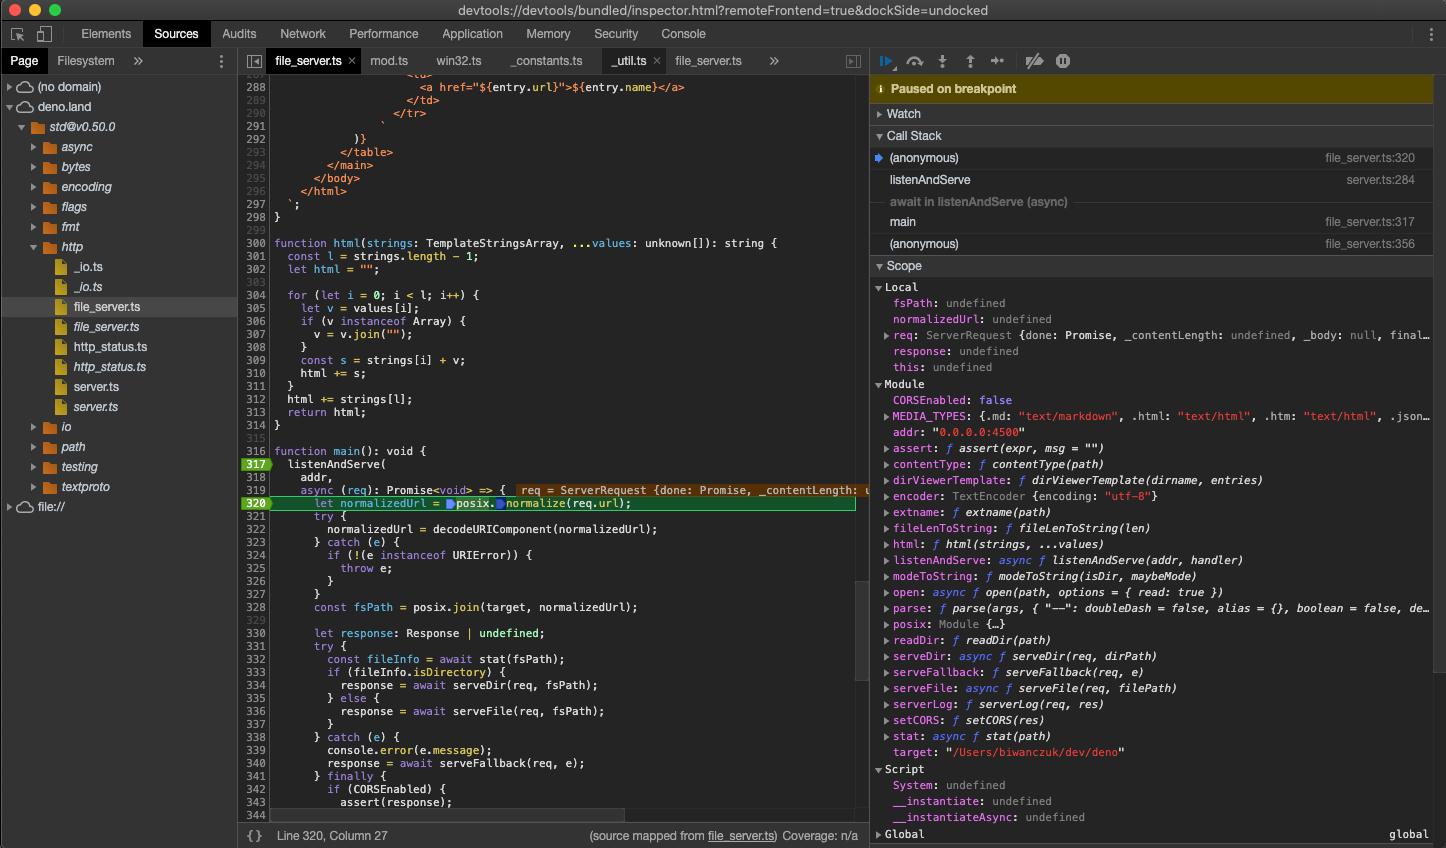
At this point all source code is available in the DevTools, so let's open up
file_server.ts and add a breakpoint there; go to "Sources" pane and expand the
tree:
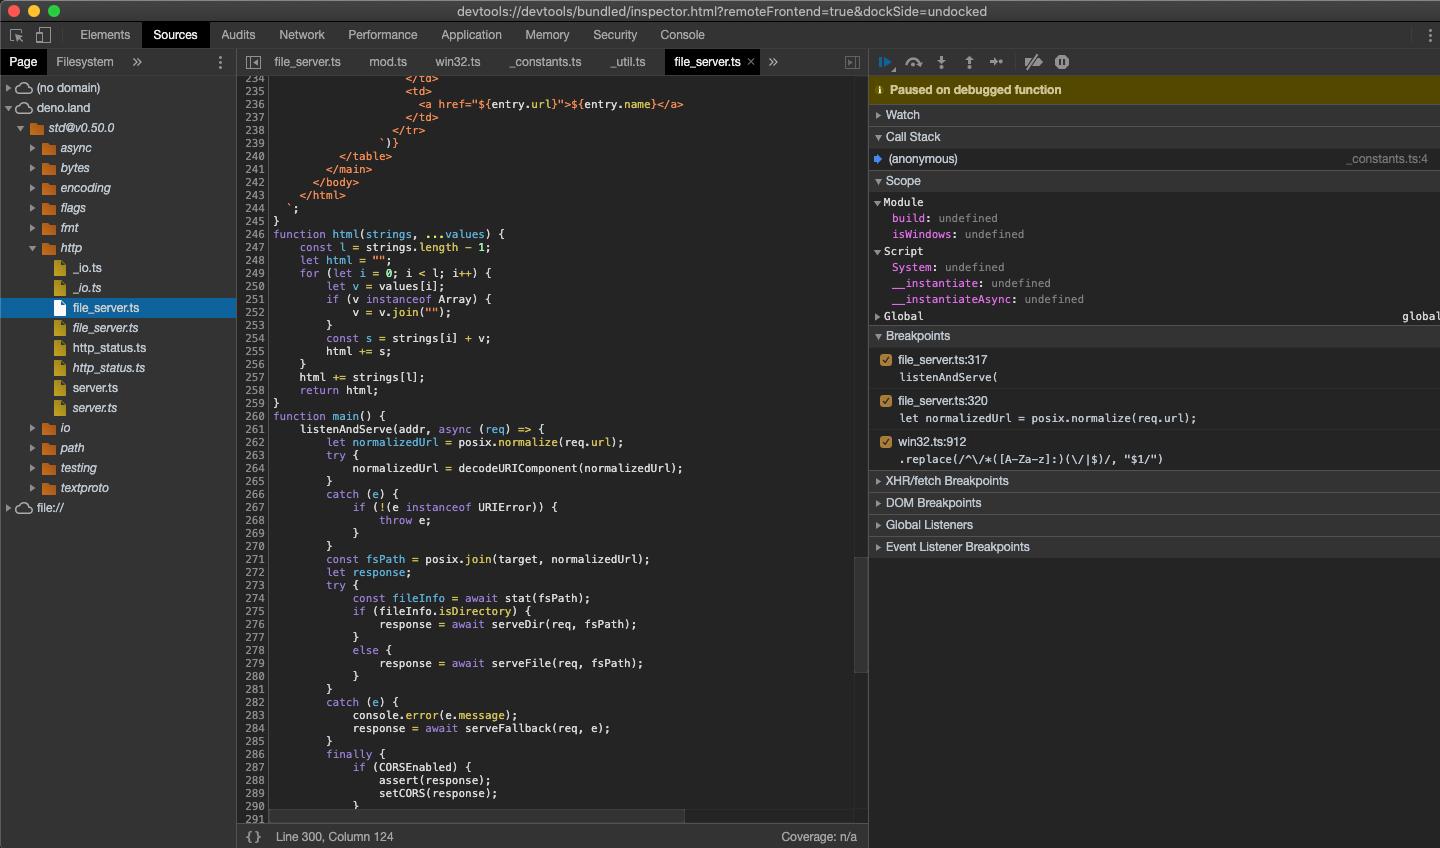
Looking closely you'll find duplicate entries for each file; one written
regularly and one in italics. The former is compiled source file (so in the case
of .ts files it will be emitted JavaScript source), while the latter is a
source map for the file.
Next, add a breakpoint in the listenAndServe method:
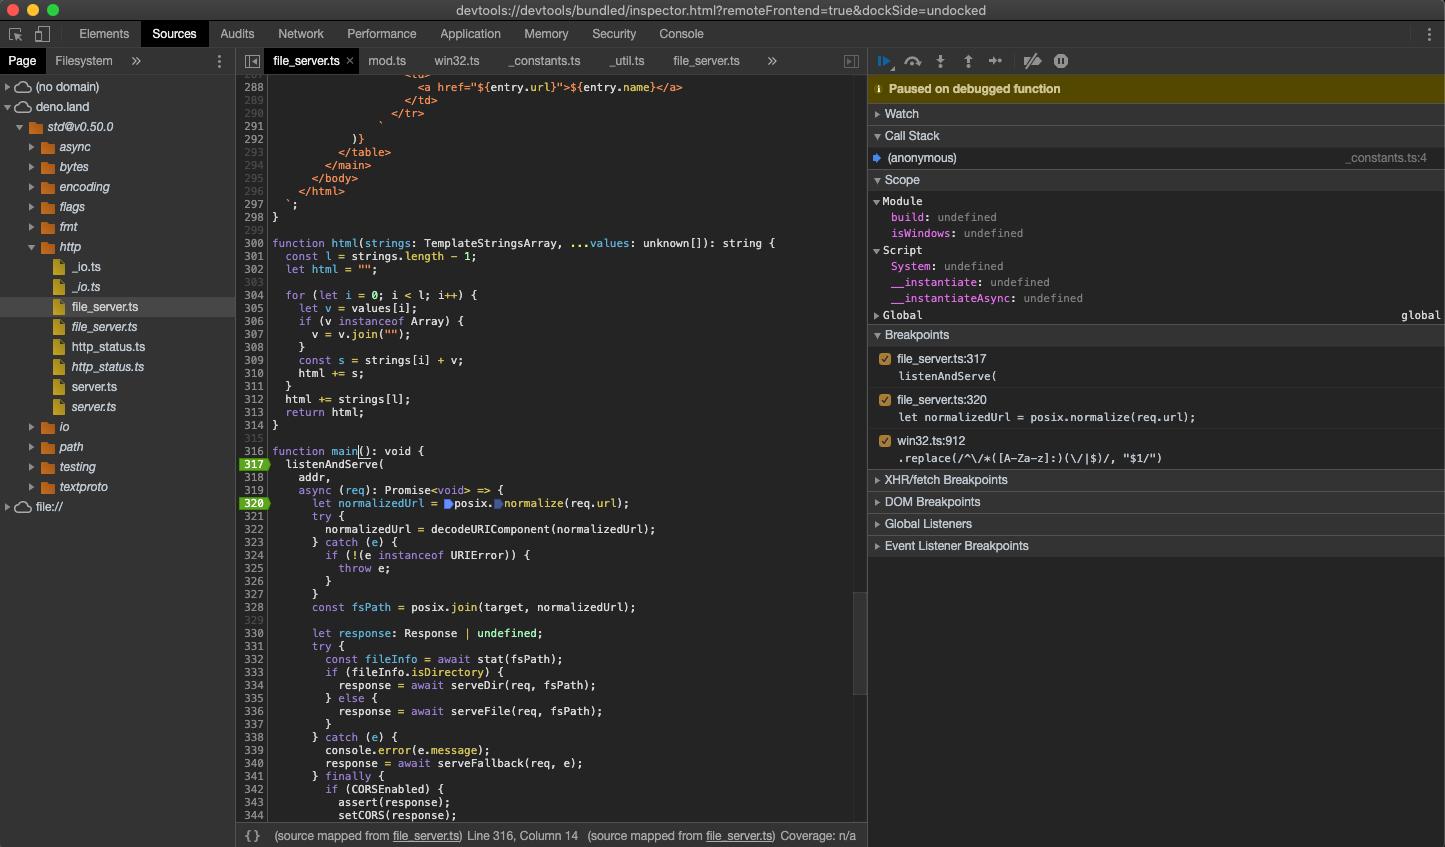
As soon as we've added the breakpoint, DevTools automatically opens up the source map file, which allows us step through the actual source code that includes types.
Now that we have our breakpoints set, we can resume the execution of our script so that we can inspect an incoming request. Hit the "Resume script execution" button to do so. You might even need to hit it twice!
Once our script is running, try send a request and inspect it in Devtools:
curl http://0.0.0.0:4507/
At this point we can introspect the contents of the request and go step-by-step to debug the code.
VSCode Jump to heading
Deno can be debugged using VSCode. This is best done with help from the official
vscode_deno extension. Documentation for this can be found
here.
JetBrains IDEs Jump to heading
Note: make sure you have this Deno plugin installed and enabled in Preferences / Settings | Plugins. For more information, see this blog post.
You can debug Deno using your JetBrains IDE by right-clicking the file you want
to debug and selecting the Debug 'Deno: <file name>' option.
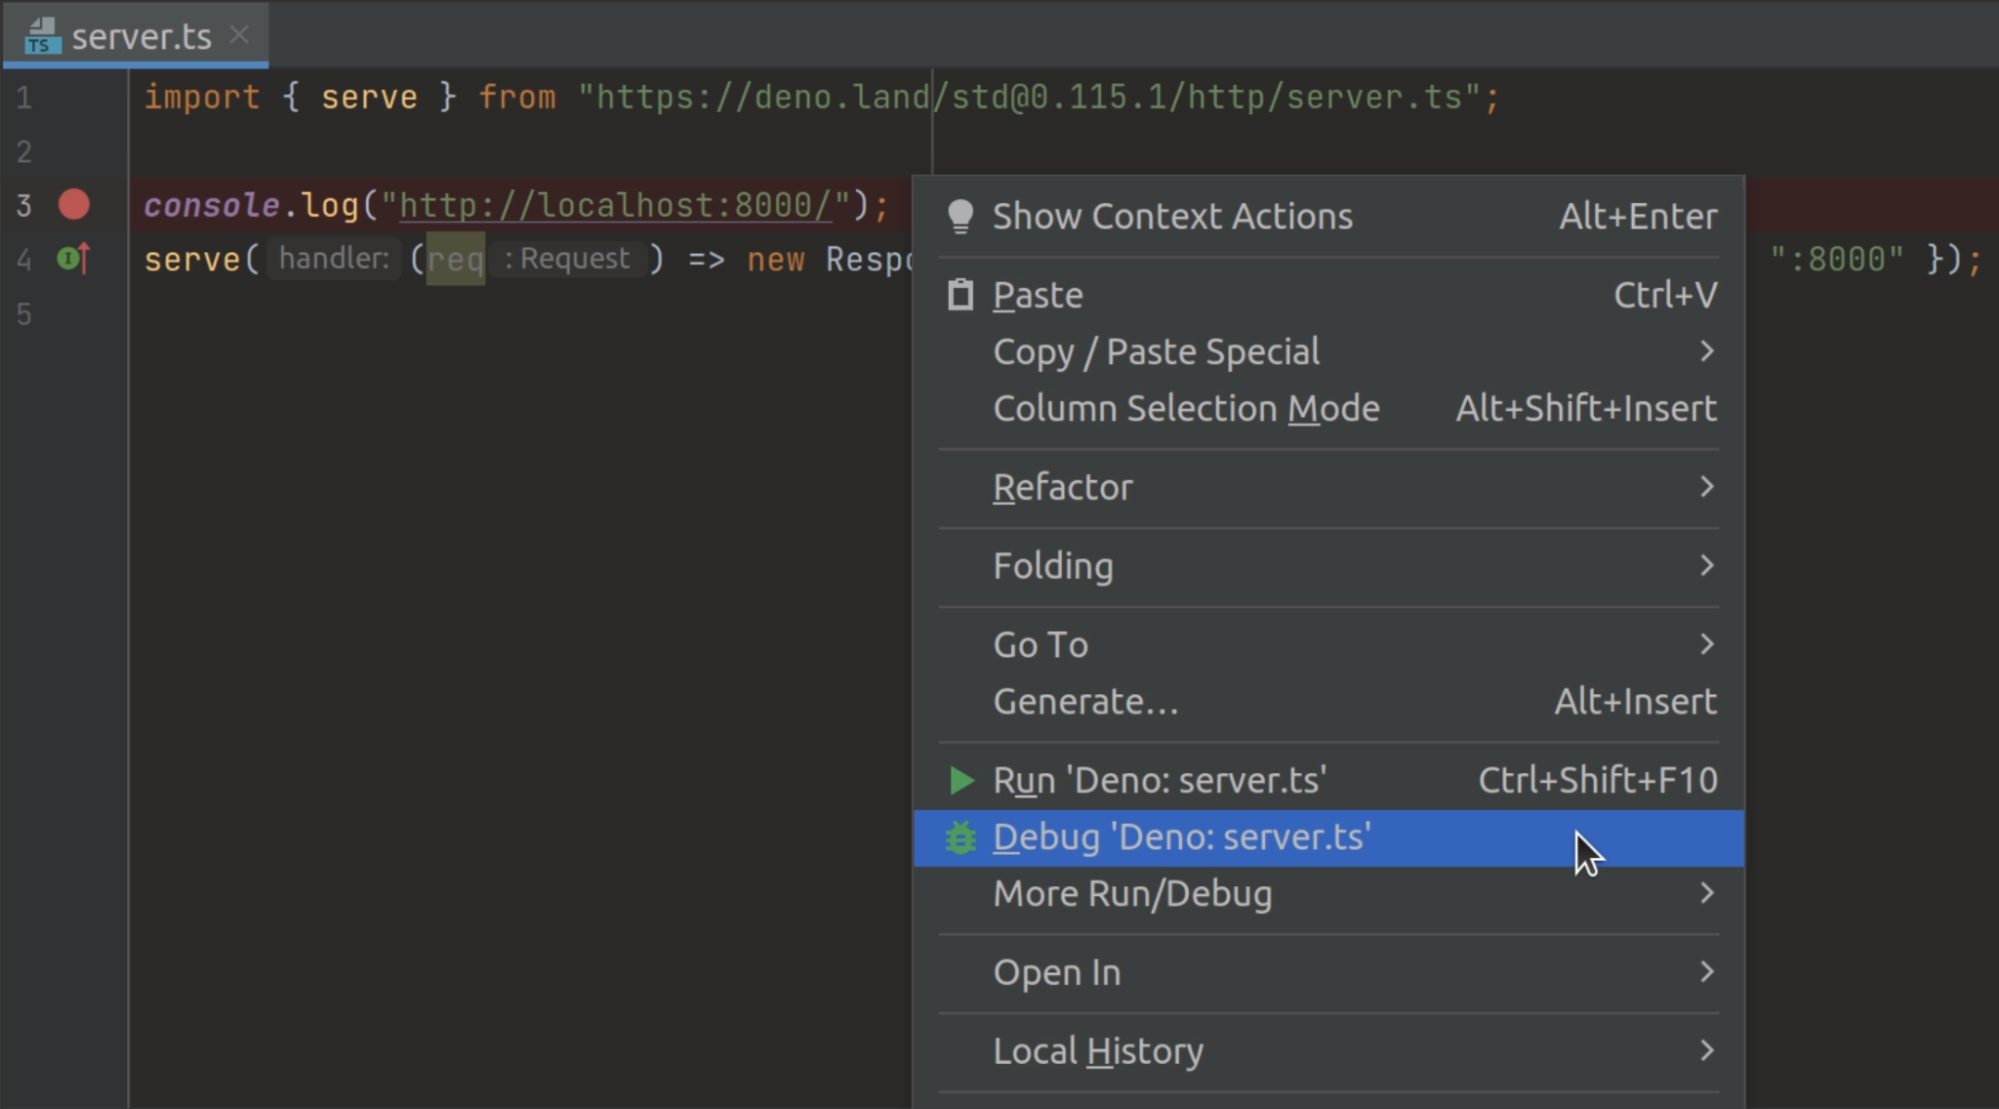
This will create a run/debug configuration with no permission flags set. If you
want to configure them, open your run/debug configuration and add the required
flags to the Command field.
--log-level=debug Jump to heading
If you're having trouble connecting to the inspector, you can use the
--log-level=debug flag to get more information about what's happening. This
will show you information like module resolution, network requests, and other
permission checks.
deno run --inspect-brk --log-level=debug your_script.ts
--strace-ops Jump to heading
Deno ops are an RPC
mechanism between JavaScript and Rust. They provide functionality like file I/O,
networking, and timers to JavaScript. The --strace-ops flag will print out all
ops that are being executed by Deno when a program is run along with their
timings.
deno run --strace-ops your_script.ts
Each op should have a Dispatch and a Complete event. The time between these
two events is the time taken to execute the op. This flag can be useful for
performance profiling, debugging hanging programs, or understanding how Deno
works under the hood.
CPU Profiling Jump to heading
Deno includes built-in support for V8 CPU profiling, which helps you identify
performance bottlenecks in your code. Use the --cpu-prof flag to capture a CPU
profile during program execution:
deno run --cpu-prof your_script.ts
When your program exits, Deno will write a .cpuprofile file to the current
directory (e.g., CPU.1769017882255.25986.cpuprofile). This file can be loaded
into Chrome DevTools (Performance tab) or other V8 profile viewers for analysis.
CPU profiling flags Jump to heading
| Flag | Description |
|---|---|
--cpu-prof |
Enable CPU profiling. Profile is written to disk on exit. |
--cpu-prof-dir=<DIR> |
Directory where the CPU profile will be written. Defaults to current directory. Implicitly enables --cpu-prof. |
--cpu-prof-name=<NAME> |
Filename for the CPU profile. Defaults to CPU.<timestamp>.<pid>.cpuprofile. |
--cpu-prof-interval=<MICROSECONDS> |
Sampling interval in microseconds. Default is 1000 (1ms). Lower values give more detail but larger files. |
--cpu-prof-md |
Generate a human-readable Markdown report alongside the .cpuprofile file. |
CPU profiles report line numbers from the transpiled JavaScript code, not the original TypeScript source. This is a limitation of V8's profiler. For TypeScript files, the reported line numbers may not match your source code directly.
Analyzing profiles in Chrome DevTools Jump to heading
To analyze the .cpuprofile file:
- Open Chrome DevTools (F12)
- Go to the Performance tab
- Click the Load profile button (up arrow icon)
- Select your
.cpuprofilefile
The DevTools will display a flame chart and detailed breakdown of where time was spent in your application.
Example: Markdown report Jump to heading
The --cpu-prof-md flag generates a Markdown summary that's easy to read
without loading the profile into DevTools:
deno run -A --cpu-prof --cpu-prof-md server.js
This creates both a .cpuprofile file and a .md file with a report like:
# CPU Profile

| Duration | Samples | Interval | Functions |
| -------- | ------- | -------- | --------- |
| 833.06ms | 641     | 1000us   | 10        |

**Top 10:** `op_crypto_get_random_values` 98.5%, `(garbage collector)` 0.7%,
`getRandomValues` 0.6%, `assertBranded` 0.2%

## Hot Functions (Self Time)

| Self% |     Self | Total% |    Total | Function                      | Location          |
| ----: | -------: | -----: | -------: | ----------------------------- | ----------------- |
| 98.5% | 533.00ms |  98.5% | 533.00ms | `op_crypto_get_random_values` | [native code]     |
|  0.7% |   4.00ms |   0.7% |   4.00ms | `(garbage collector)`         | [native code]     |
|  0.6% |   3.00ms |   0.6% |   3.00ms | `getRandomValues`             | 00_crypto.js:5274 |
|  0.2% |   1.00ms |   0.2% |   1.00ms | `assertBranded`               | 00_webidl.js:1149 |

## Call Tree (Total Time)

| Total% |    Total | Self% |     Self | Function                      | Location          |
| -----: | -------: | ----: | -------: | ----------------------------- | ----------------- |
|  16.8% |  91.00ms | 16.8% |  91.00ms | `(anonymous)`                 | server.js:1       |
|   0.6% |   3.00ms |  0.6% |   3.00ms | `getRandomValues`             | 00_crypto.js:5274 |
|  98.5% | 533.00ms | 98.5% | 533.00ms | `op_crypto_get_random_values` | [native code]     |

## Function Details

### `op_crypto_get_random_values`

[native code] | Self: 98.5% (533.00ms) | Total: 98.5% (533.00ms) | Samples: 533
The report includes:
- Summary: Total duration, sample count, sampling interval, and function count
- Top 10: Quick overview of the most expensive functions
- Hot Functions: Functions sorted by self time (time spent in the function itself, excluding callees)
- Call Tree: Hierarchical view showing the call stack and time distribution
- Function Details: Per-function breakdown with sample counts
OpenTelemetry integration Jump to heading
For production applications or complex systems, OpenTelemetry provides a more comprehensive approach to observability and debugging. Deno includes built-in support for OpenTelemetry, allowing you to:
- Trace requests through your application
- Monitor application performance metrics
- Collect structured logs
- Export telemetry data to monitoring systems
OTEL_DENO=true deno run your_script.ts
This will automatically collect and export runtime observability data, including:
- HTTP request traces
- Runtime metrics
- Console logs and errors
For full details on Deno's OpenTelemetry integration, including custom metrics, traces, and configuration options, see the OpenTelemetry documentation.
TLS session debugging Jump to heading
Set the SSLKEYLOGFILE environment variable to log TLS session keys to a file.
This enables you to decrypt and inspect encrypted network traffic with tools
like Wireshark:
SSLKEYLOGFILE=./keys.log deno run -N main.ts
Then load keys.log in Wireshark (Edit > Preferences > Protocols > TLS >
(Pre)-Master-Secret log filename) to decrypt captured TLS traffic.