On this page
Distributed Tracing with Context Propagation in Deno
Modern applications are often built as distributed systems with multiple services communicating with each other. When debugging issues or optimizing performance in these systems, it's crucial to be able to trace requests as they flow through different services. This is where distributed tracing comes in.
As of Deno 2.3, the runtime now automatically preserves trace context across service boundaries, making end-to-end tracing in distributed systems simpler and more powerful. This means that when one service makes a request to another, the trace context is automatically propagated, allowing you to see the entire request flow as a single trace.
Setting up a distributed system Jump to heading
Our example system will consist of two parts:
- A server that provides an API endpoint
- A client that makes requests to the server
The server Jump to heading
We'll set up a simple HTTP server that responds to GET requests with a JSON message:
import { trace } from "npm:@opentelemetry/api@1";

const tracer = trace.getTracer("api-server", "1.0.0");

// Create a simple API server with Deno.serve
Deno.serve({ port: 8000 }, (req) => {
  return tracer.startActiveSpan("process-api-request", async (span) => {
    // Add attributes to the span for better context
    span.setAttribute("http.route", "/");
    span.updateName("GET /");

    // Add a span event to see in traces
    span.addEvent("processing_request", {
      request_id: crypto.randomUUID(),
      timestamp: Date.now(),
    });

    // Simulate processing time
    await new Promise((resolve) => setTimeout(resolve, 50));

    console.log("Server: Processing request in trace context");

    // End the span when we're done
    span.end();

    return new Response(JSON.stringify({ message: "Hello from server!" }), {
      headers: { "Content-Type": "application/json" },
    });
  });
});
The client Jump to heading
Now, let's create a client that will make requests to our server:
import { SpanStatusCode, trace } from "npm:@opentelemetry/api@1";

const tracer = trace.getTracer("api-client", "1.0.0");

// Create a parent span for the client operation
await tracer.startActiveSpan("call-api", async (parentSpan) => {
  try {
    console.log("Client: Starting API call");

    // The fetch call inside this span will automatically:
    // 1. Create a child span for the fetch operation
    // 2. Inject the trace context into the outgoing request headers
    const response = await fetch("http://localhost:8000/");
    const data = await response.json();

    console.log(`Client: Received response: ${JSON.stringify(data)}`);

    parentSpan.addEvent("received_response", {
      status: response.status,
      timestamp: Date.now(),
    });
  } catch (error) {
    console.error("Error calling API:", error);
    if (error instanceof Error) {
      parentSpan.recordException(error);
    }
    parentSpan.setStatus({
      code: SpanStatusCode.ERROR,
      message: error instanceof Error ? error.message : String(error),
    });
  } finally {
    parentSpan.end();
  }
});
Tracing with OpenTelemetry Jump to heading
Both the client and server code already include basic OpenTelemetry instrumentation:
-
Create a tracer - both files create a tracer using
trace.getTracer()with a name and version. -
Create spans - We use
startActiveSpan()to create spans that represent operations. -
Add context - We add attributes and events to spans to provide more context.
-
Ending spans - We make sure to end spans when operations are complete.
Automatic context propagation Jump to heading
The magic happens when the client makes a request to the server. In the client code there is a fetch call to the server:
const response = await fetch("http://localhost:8000/");
Since this fetch call happens inside an active span, Deno automatically creates a child span for the fetch operation and Injects the trace context into the outgoing request headers.
When the server receives this request, Deno extracts the trace context from the request headers and establishes the server span as a child of the client's span.
Running the example Jump to heading
To run this example, first, start the server, giving your otel service a name:
OTEL_DENO=true OTEL_SERVICE_NAME=server deno run --allow-net server.ts
Then, in another terminal, run the client, giving the client a different service name to make observing the propagation clearer:
OTEL_DENO=true OTEL_SERVICE_NAME=client deno run --allow-net client.ts
You should see:
- The client logs "Client: Starting API call"
- The server logs "Server: Processing request in trace context"
- The client logs the response received from the server
Viewing traces Jump to heading
To actually see the traces, you'll need an OpenTelemetry collector and a visualization tool, for example Grafana Tempo.
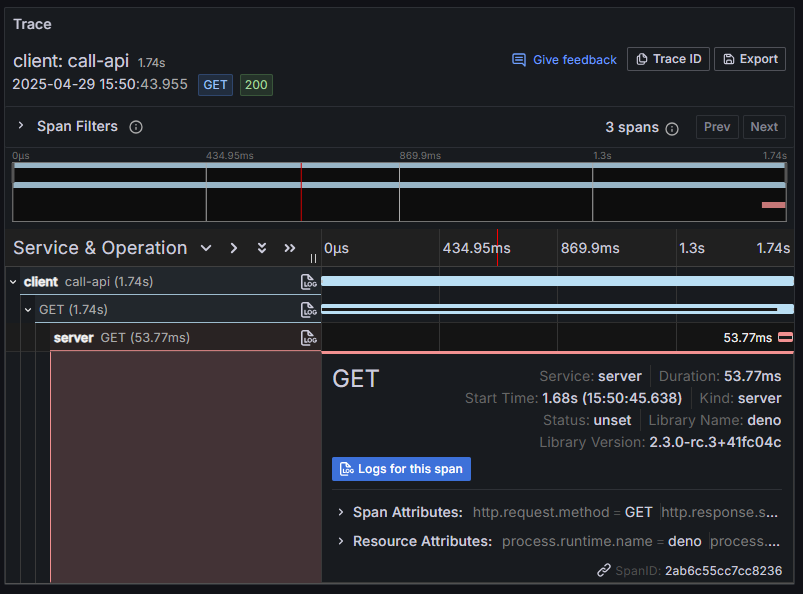
When you visualize the traces, you'll see:
- A parent span from the client
- Connected to a child span for the HTTP request
- Connected to a span from the server
- All as part of a single trace!
For example, in Grafana, the trace visualization may look like this:
🦕 Now that you understand distributed tracing with Deno, you could extend this to more complex systems with multiple services and async operations.
With Deno's automatic context propagation, implementing distributed tracing in your applications has never been easier!