On this page
How to export telemetry data to Grafana
OpenTelemetry (often abbreviated as OTel) is an open-source observability framework that provides a standardized way to collect and export telemetry data such as traces, metrics and logs. Deno has built-in support for OpenTelemetry, making it easy to instrument your applications without adding external dependencies. This integration works out of the box with observability platforms like Grafana.
Grafana is an open-source observability platform that lets DevOps teams visualize, query, and alert on metrics, logs, and traces from diverse data sources in real time. It’s widely used for building dashboards to monitor infrastructure, applications, and systems health.
Grafana also offers a hosted version called Grafana Cloud. This tutorial will help you configure your project to export OTel data to Grafana Cloud.
In this tutorial, we'll build a simple application and export its telemetry data to Grafana Cloud. We'll cover:
You can find the complete source code for this tutorial on GitHub.
Set up your chat app Jump to heading
For this tutorial, we'll use a simple chat application to demonstrate how to export telemetry data. You can find the code for the app on GitHub.
Either take a copy of that repository or create a main.ts file and a .env file.
In order to run the app you will need an OpenAI API key. You can get one by
signing up for an account at OpenAI and
creating a new secret key. You can find your API key in the
API keys section of your OpenAI
account. Once you have an API key, set up an OPENAI_API-KEY environment
variable in your .env file:
OPENAI_API_KEY=your_openai_api_key
Set up a Docker collector Jump to heading
Next, we'll set up a Docker container to run the OpenTelemetry collector. The collector is responsible for receiving telemetry data from your application and exporting it to Grafana Cloud.
In the same directory as your main.ts file, create a Dockerfile and an
otel-collector.yml file. The Dockerfile will be used to build a Docker
image:
FROM otel/opentelemetry-collector-contrib:latest

COPY otel-collector.yml /otel-config.yml

CMD ["--config", "/otel-config.yml"]
FROM otel/opentelemetry-collector-contrib:latest -
This line specifies the base image for the container. It uses the official
OpenTelemetry Collector Contributor image, which contains all receivers,
exporters, processors, connectors, and other optional components, and pulls the
latest version.
COPY otel-collector.yml /otel-config.yml - This instruction copies our
configuration file named otel-collector.yml from the local build context into
the container. The file is renamed to /otel-config.yml inside the container.
CMD ["--config", "/otel-config.yml"] - This sets the default command that will
run when the container starts. It tells the OpenTelemetry Collector to use the
configuration file we copied in the previous step.
Next, let's setup a Grafana Cloud account and grab some info.
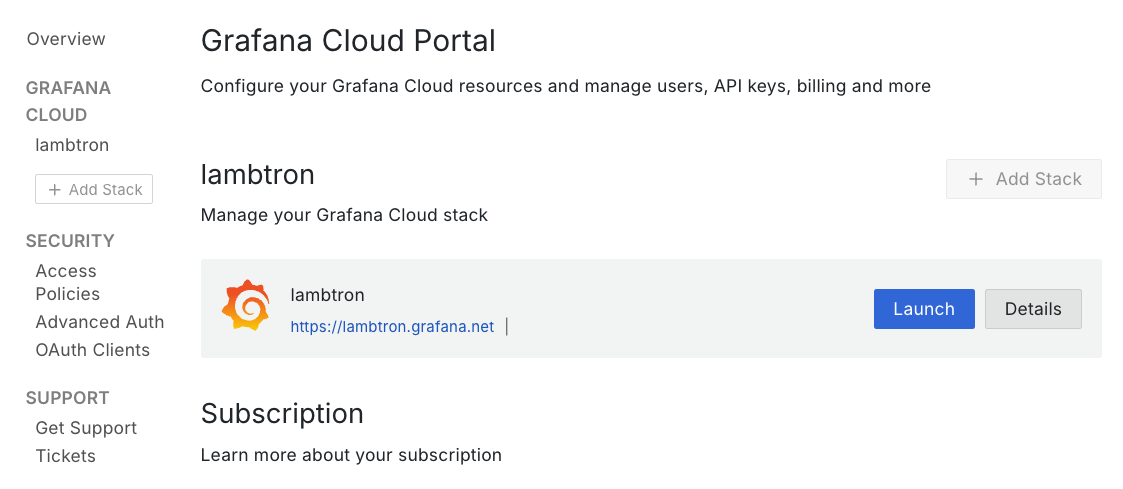
If you have not already, create a free Grafana Cloud account. Once created, you will receive a Grafana Cloud stack. Click "Details".
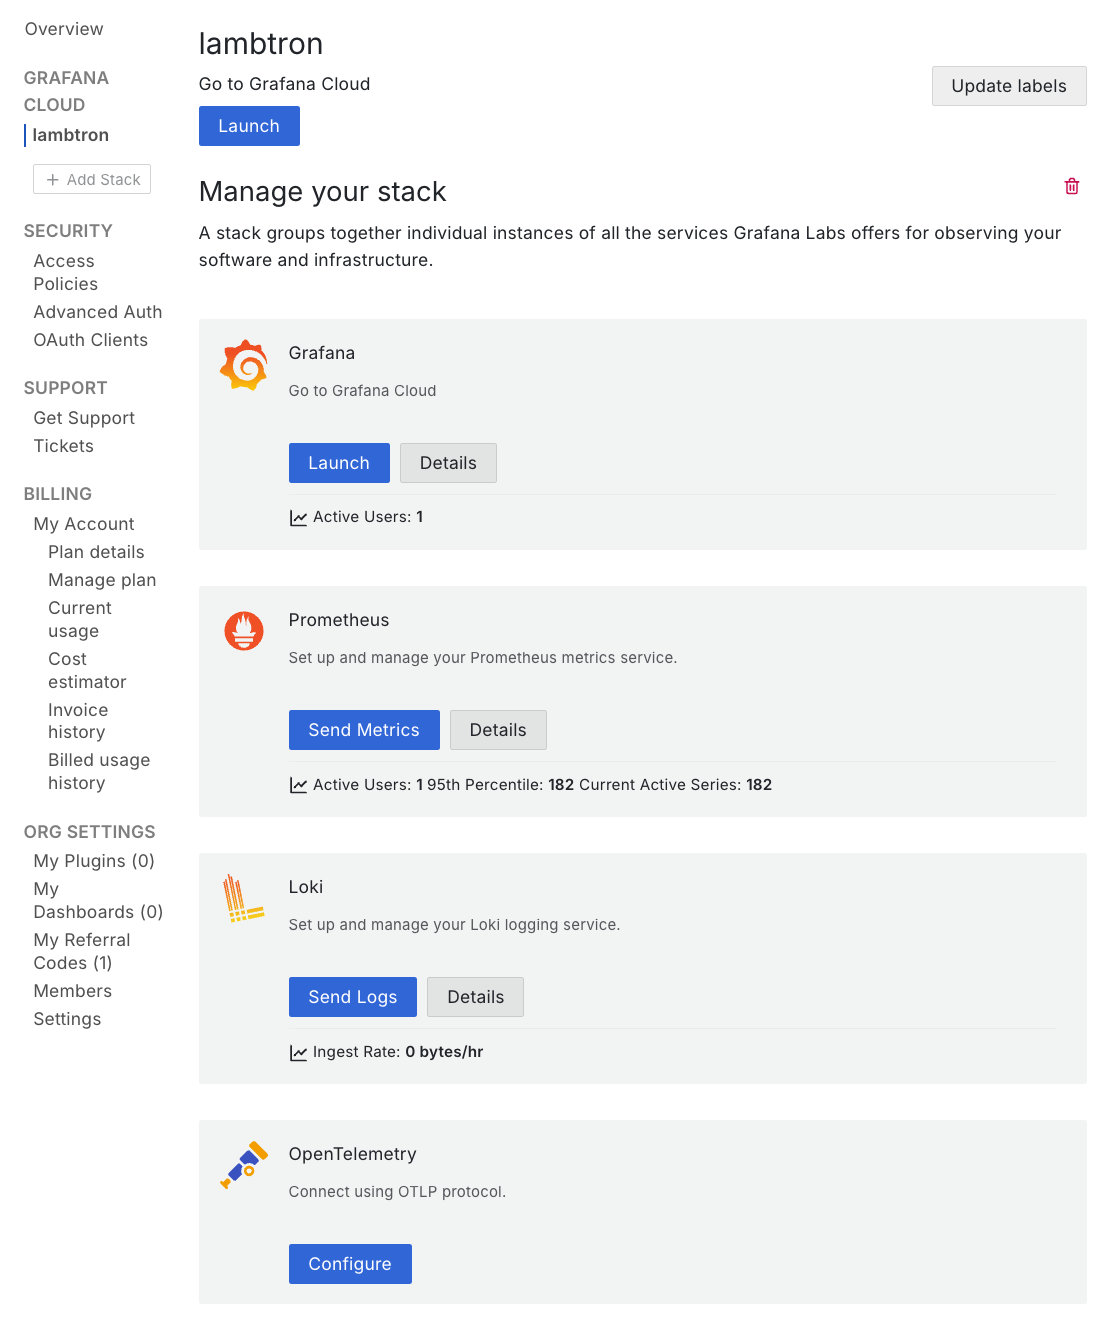
Next, find "OpenTelemetry" and click "Configure".
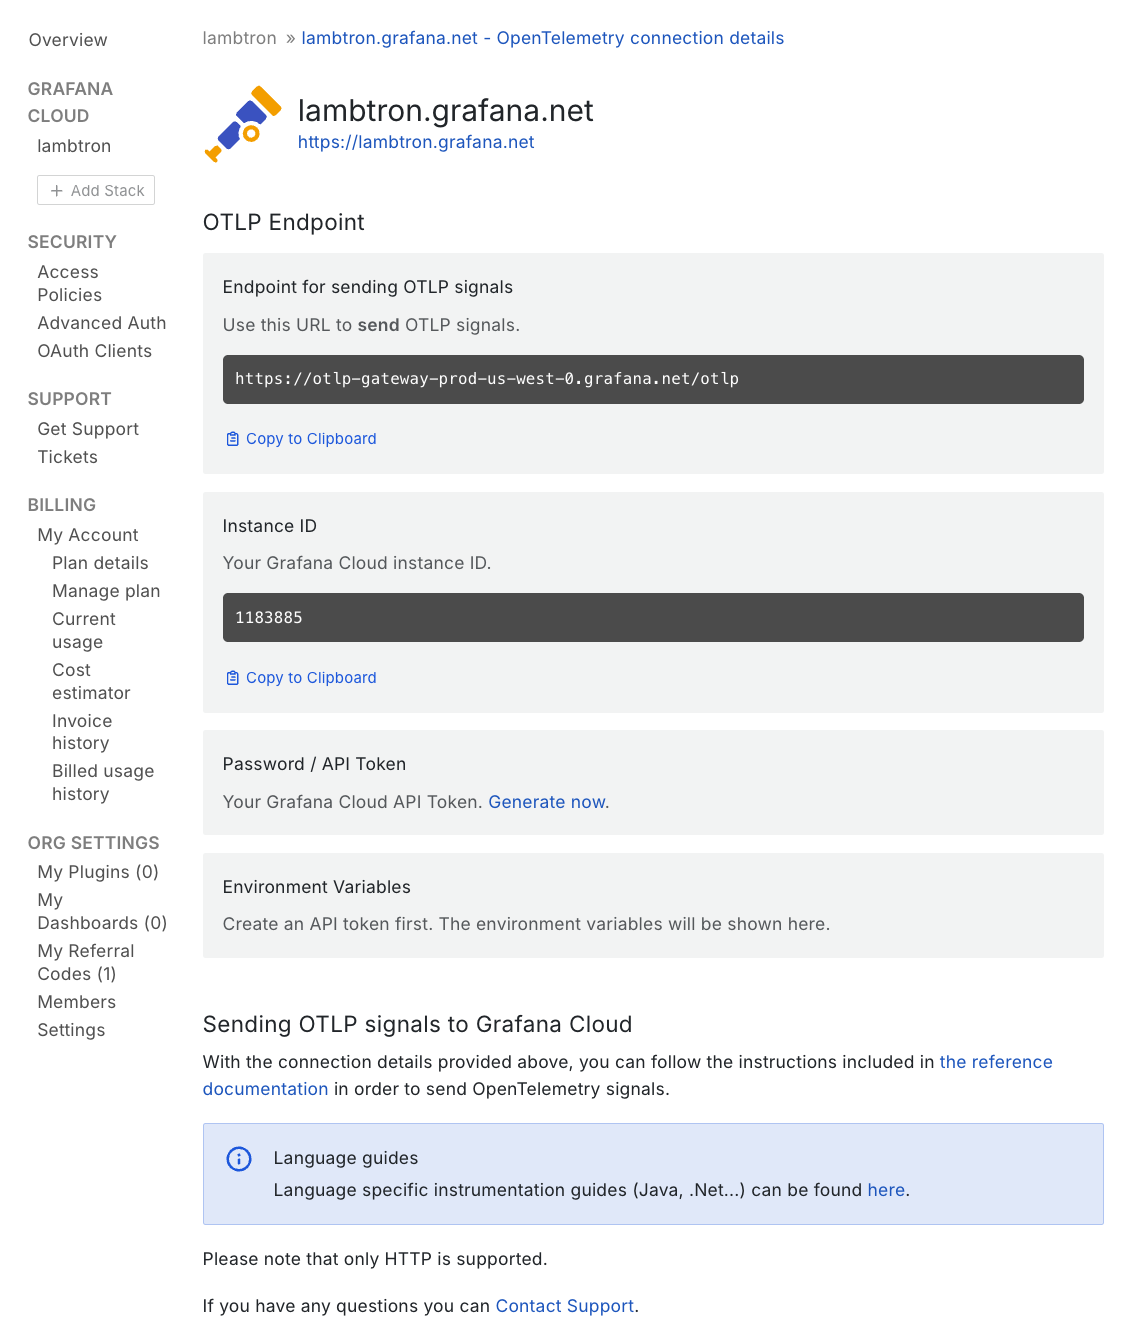
This page will provide you with all the details you'll need to configure your OpenTelemetry collector. Make note of your OTLP Endpoint, Instance ID, and Password / API Token (you will have to generate one).
Next, add the following to your otel-collector.yml file to define how how
telemetry data should be collected and exported to Grafana Cloud:
receivers:
  otlp:
    protocols:
      grpc:
        endpoint: 0.0.0.0:4317
      http:
        endpoint: 0.0.0.0:4318

exporters:
  otlphttp/grafana_cloud:
    endpoint: $_YOUR_GRAFANA_OTLP_ENDPOINT
    auth:
      authenticator: basicauth/grafana_cloud

extensions:
  basicauth/grafana_cloud:
    client_auth:
      username: $_YOUR_INSTANCE_ID
      password: $_YOUR_API_TOKEN

processors:
  batch:

service:
  extensions: [basicauth/grafana_cloud]
  pipelines:
    traces:
      receivers: [otlp]
      processors: [batch]
      exporters: [otlphttp/grafana_cloud]
    metrics:
      receivers: [otlp]
      processors: [batch]
      exporters: [otlphttp/grafana_cloud]
    logs:
      receivers: [otlp]
      processors: [batch]
      exporters: [otlphttp/grafana_cloud]
The receivers section configures how the collector receives data. It sets up
an OTLP (OpenTelemetry Protocol) receiver that listens on two protocols, gRPC
and HTTP, the 0.0.0.0 address means it will accept data from any source.
The exporters section defines where the collected data should be sent. Be sure
to include the OTLP endpoint provided by your Grafana Cloud instance.
The extensions section defines the authentication for OTel to export data to
Grafana Cloud. Be sure to include your Grafana Cloud Instance ID, as well as
your generated Password / API Token.
The processors section defines how the data should be processed before export.
It uses batch processing with a timeout of 5 seconds and a maximum batch size of
5000 items.
The service section ties everything together by defining three pipelines. Each
pipeline is responsible for a different type of telemetry data. The logs
pipeline collects application logs. The traces pipeline is for distributed
tracing data. The metric pipeline is for performance metrics.
Build and run the docker instance to start collecting your telemetry data with the following command:
docker build -t otel-collector . && docker run -p 4317:4317 -p 4318:4318 otel-collector
Generating telemetry data Jump to heading
Now that we have the app and the docker container set up, we can start generating telemetry data. Run your application with these environment variables to send data to the collector:
OTEL_EXPORTER_OTLP_ENDPOINT=http://localhost:4318 \
OTEL_SERVICE_NAME=chat-app \
OTEL_DENO=true \
deno run --allow-net --allow-env --env-file --allow-read main.ts
This command:
- Points the OpenTelemetry exporter to your local collector (
localhost:4318) - Names your service "chat-app" in Grafana Cloud
- Enables Deno's OpenTelemetry integration
- Runs your application with the necessary permissions
To generate some telemetry data, make a few requests to your running application
in your browser at http://localhost:8000.
Each request will:
- Generate traces as it flows through your application
- Send logs from your application's console output
- Create metrics about the request performance
- Forward all this data through the collector to Grafana Cloud
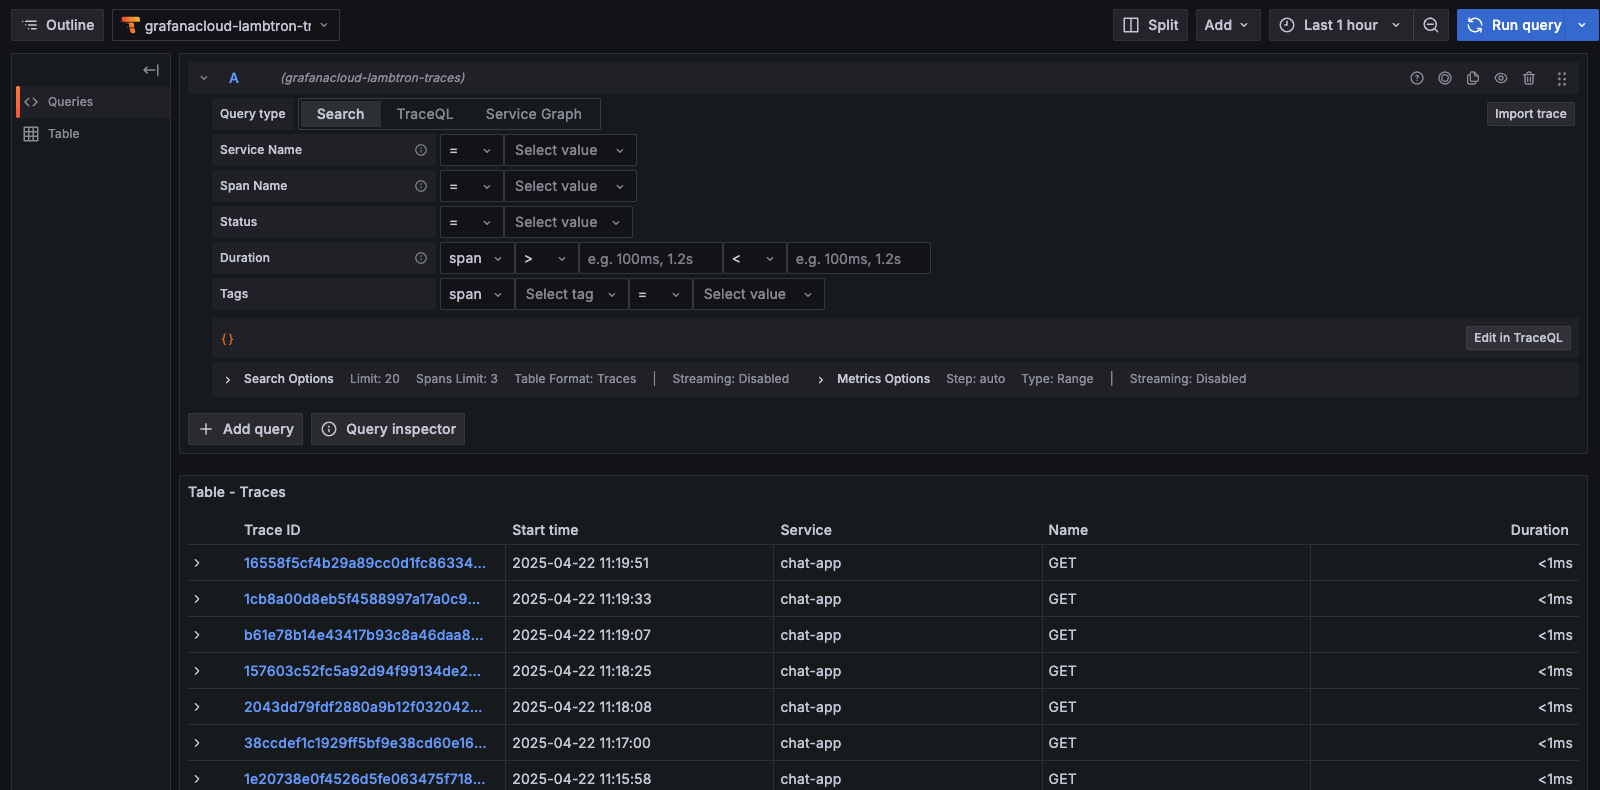
Viewing telemetry data Jump to heading
After making some requests to your application, you'll see three types of data in your Grafana Cloud dashboard:
- Traces - End-to-end request flows through your system
- Logs - Console output and structured log data
- Metrics - Performance and resource utilization data
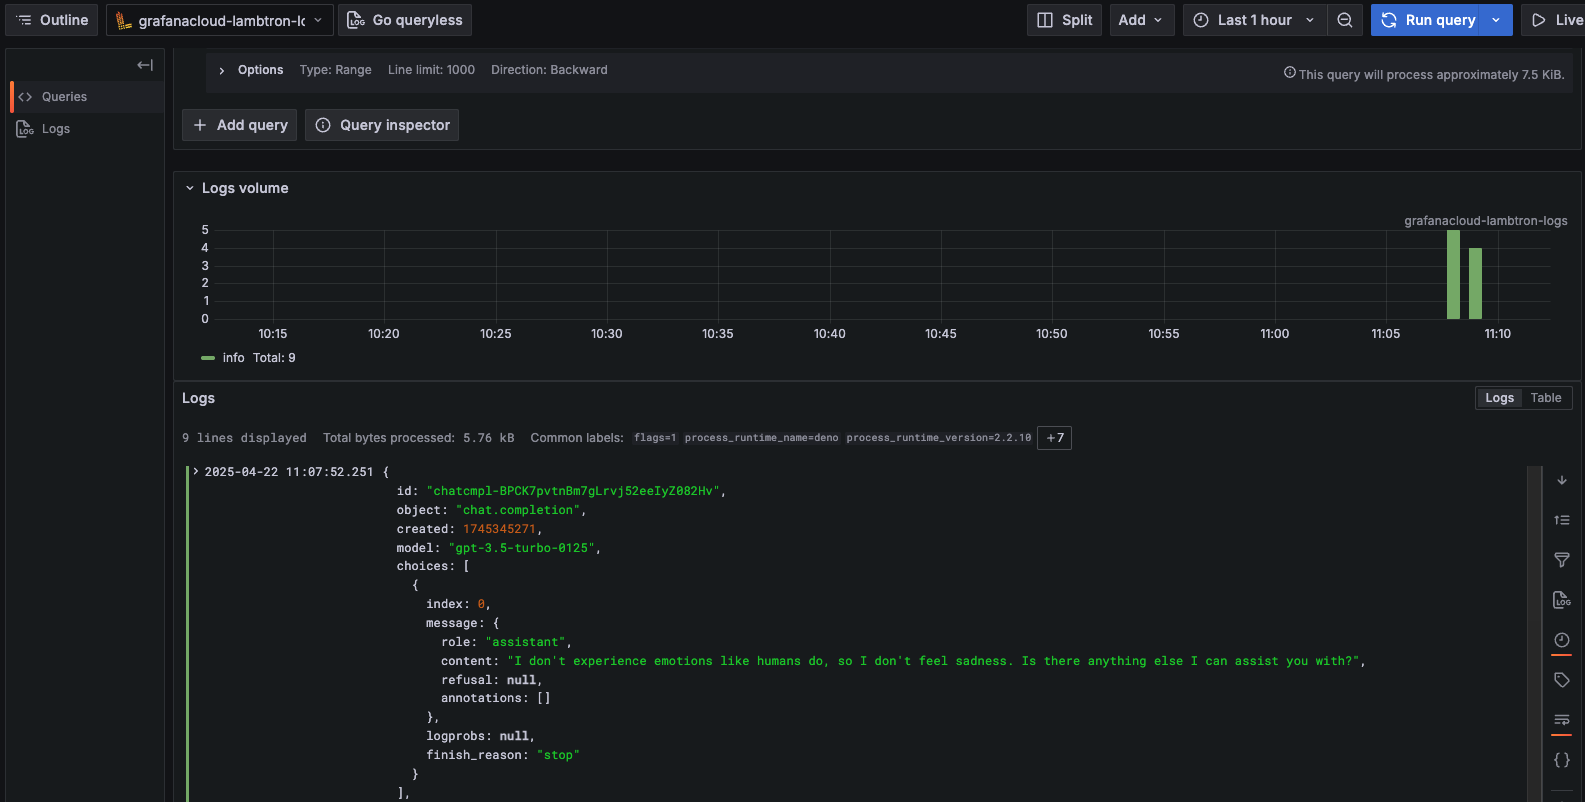
You can drill down into individual spans to debug performance issues:
🦕 Now that you have telemetry export working, you could:
- Add custom spans and attributes to better understand your application
- Set up alerts based on latency or error conditions
- Deploy your application and collector to production using platforms like:
For more details on OpenTelemetry configuration, check out the Grafana Cloud documentation.