On this page
Getting started
You are viewing the documentation for Deno DeployEA. Looking for Deploy Classic documentation? View it here.
Create an organization Jump to heading
Deno DeployEA will eventually replace Deno Deploy Classic. Until that time both systems will be available simultaneously. By creating an organisation for use with DeployEA it is possible to explore DeployEA without disrupting projects already using Deploy Classic.
To get started with Deno DeployEA:
- Visit console.deno.com
- Create an organization:
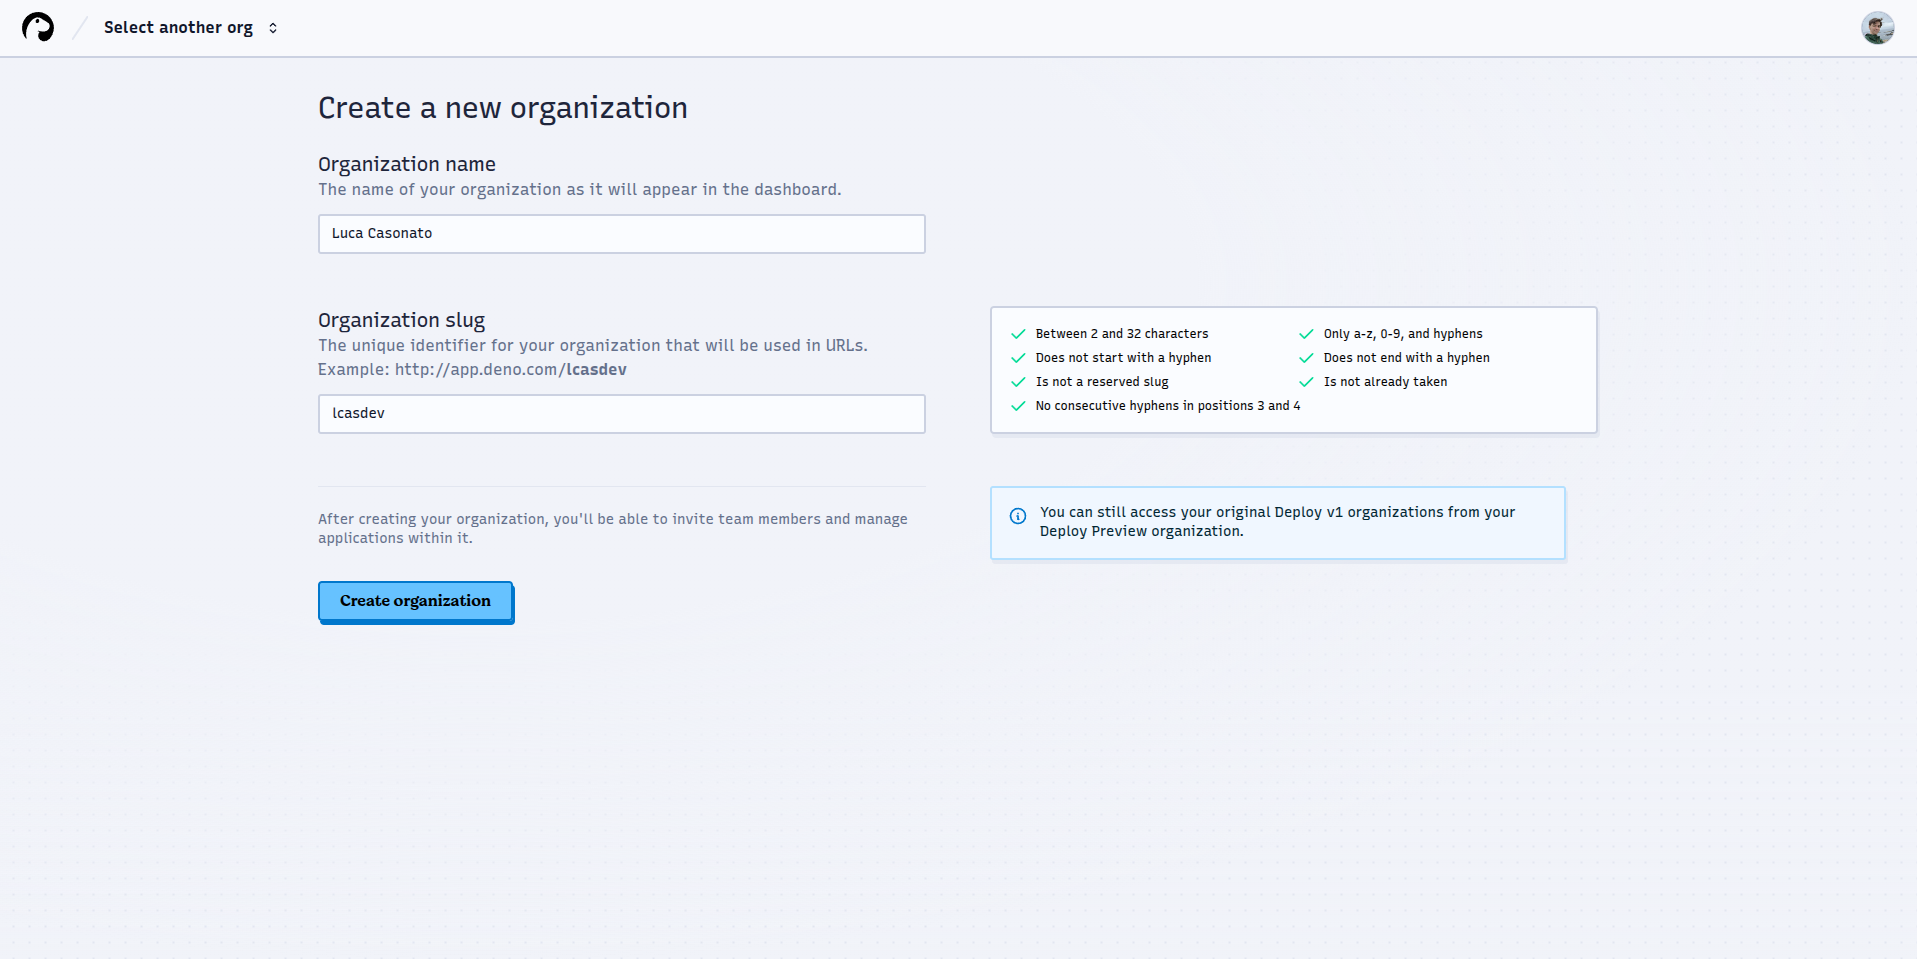
Note that you cannot create an organization with the same slug as any existing project in Deploy Classic. Organization names and slugs cannot be changed after creation.
Create an app Jump to heading
After creating an organization, you'll be directed to the organization apps page, which shows all your applications and provides access to organization settings and custom domains.
To create an app, press the + New App button:
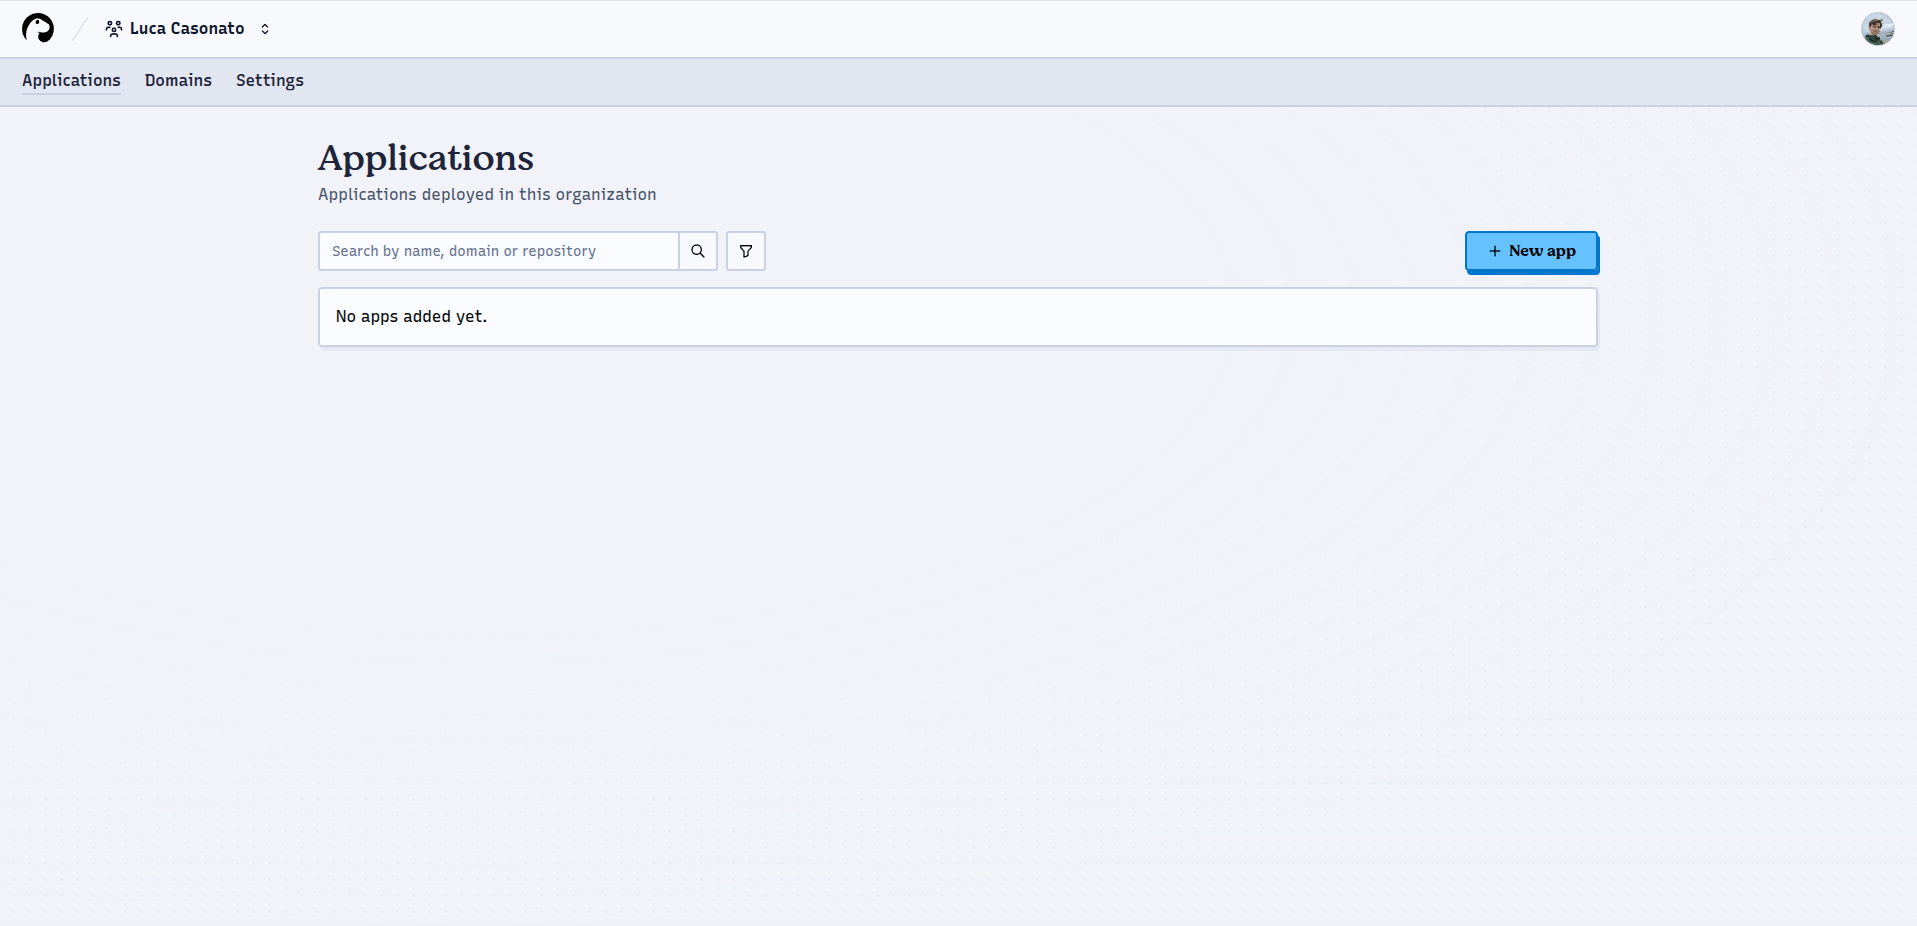
An application is a single deployed web service with one build configuration, build history, environment variables, attached custom domains, a linked GitHub repository, etc.
Select a repo Jump to heading
- Choose the GitHub repository for your application:
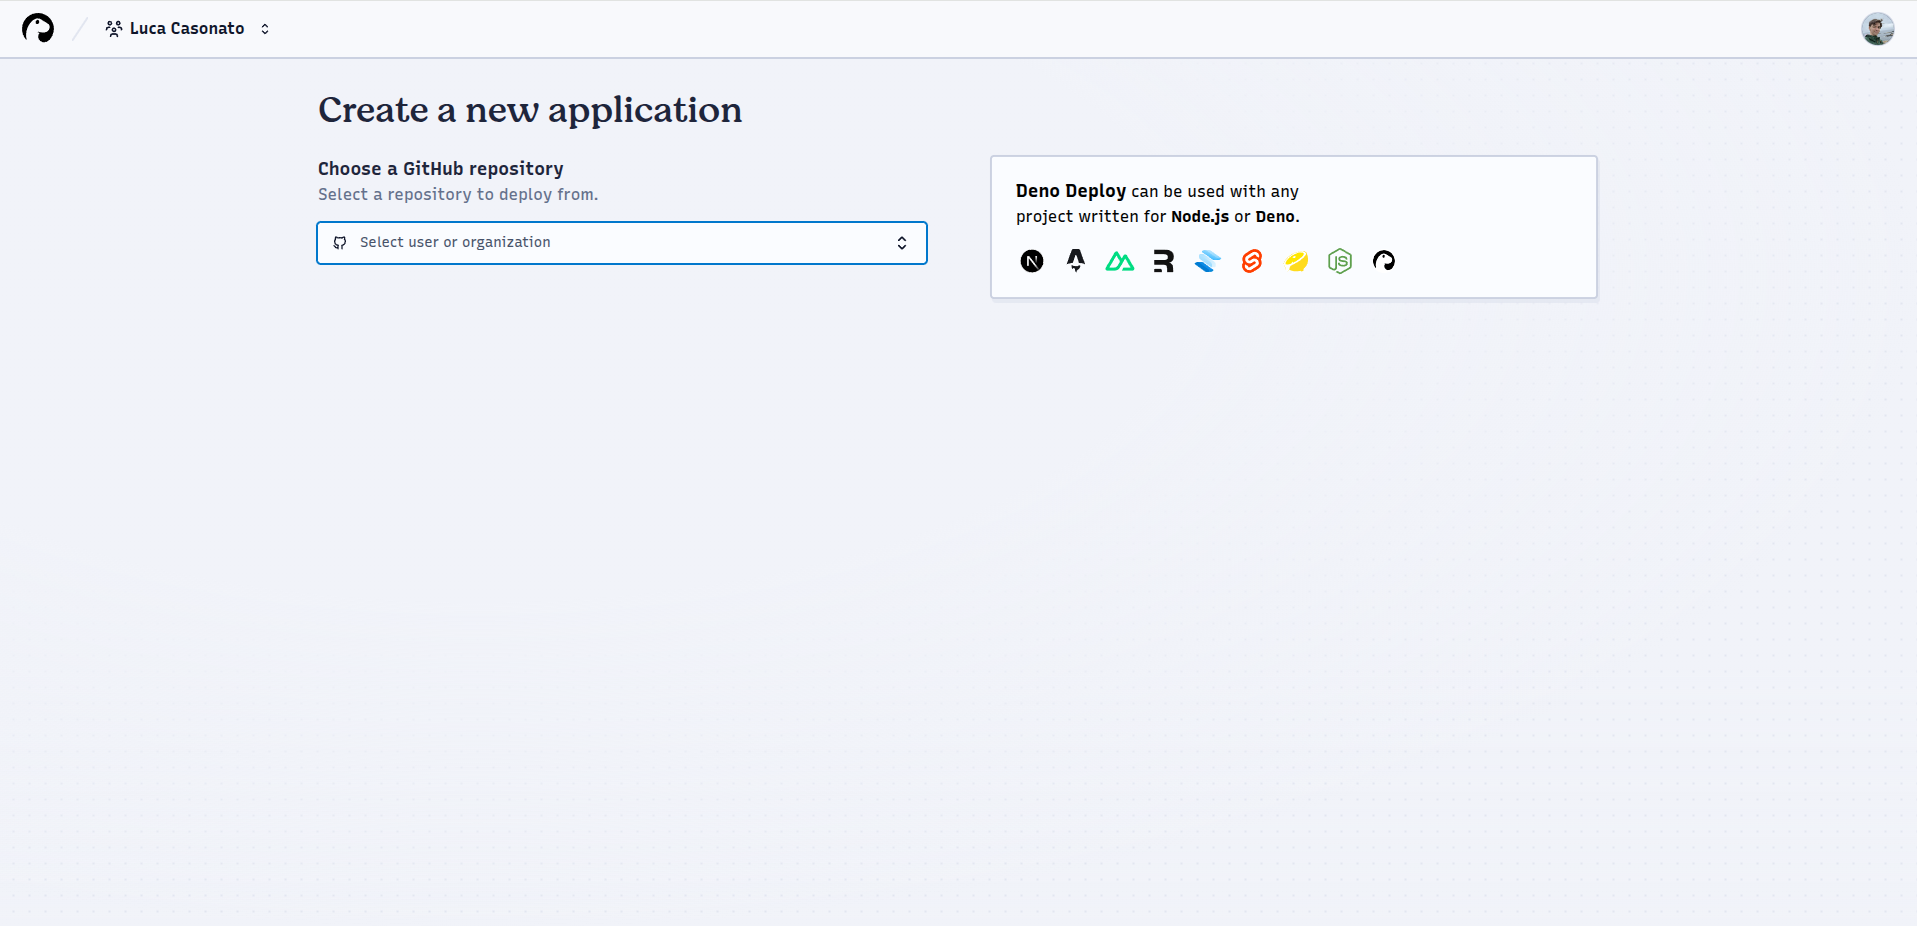
If your repository doesn't appear, use the Add another GitHub account or
Configure GitHub App permissions buttons to grant the Deno Deploy GitHub app
access to your repositories.
⏳ Mono-repos (repositories where the application lives in a subdirectory) are not yet supported.
Configure your app Jump to heading
Deno DeployEA automatically attempts to detect your application type
and configure an appropriate build setup. You can see the detected configuration
in the App Config box:
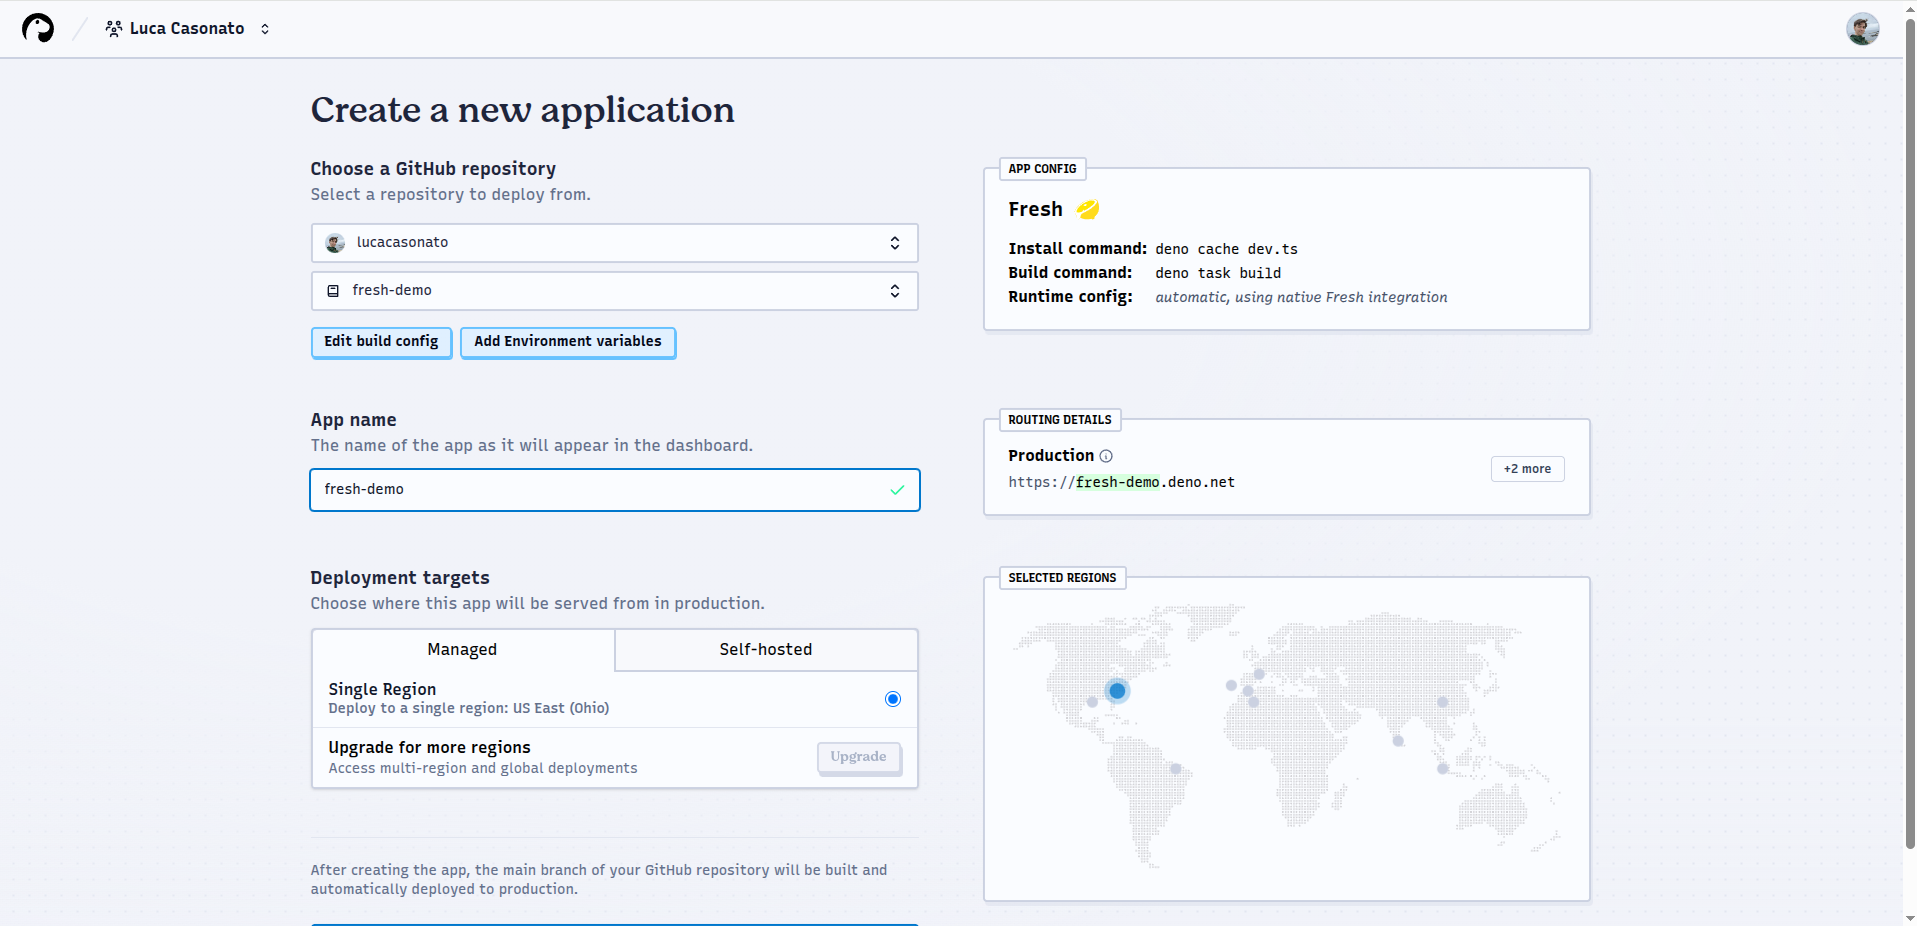
To modify this configuration, click Edit build config.
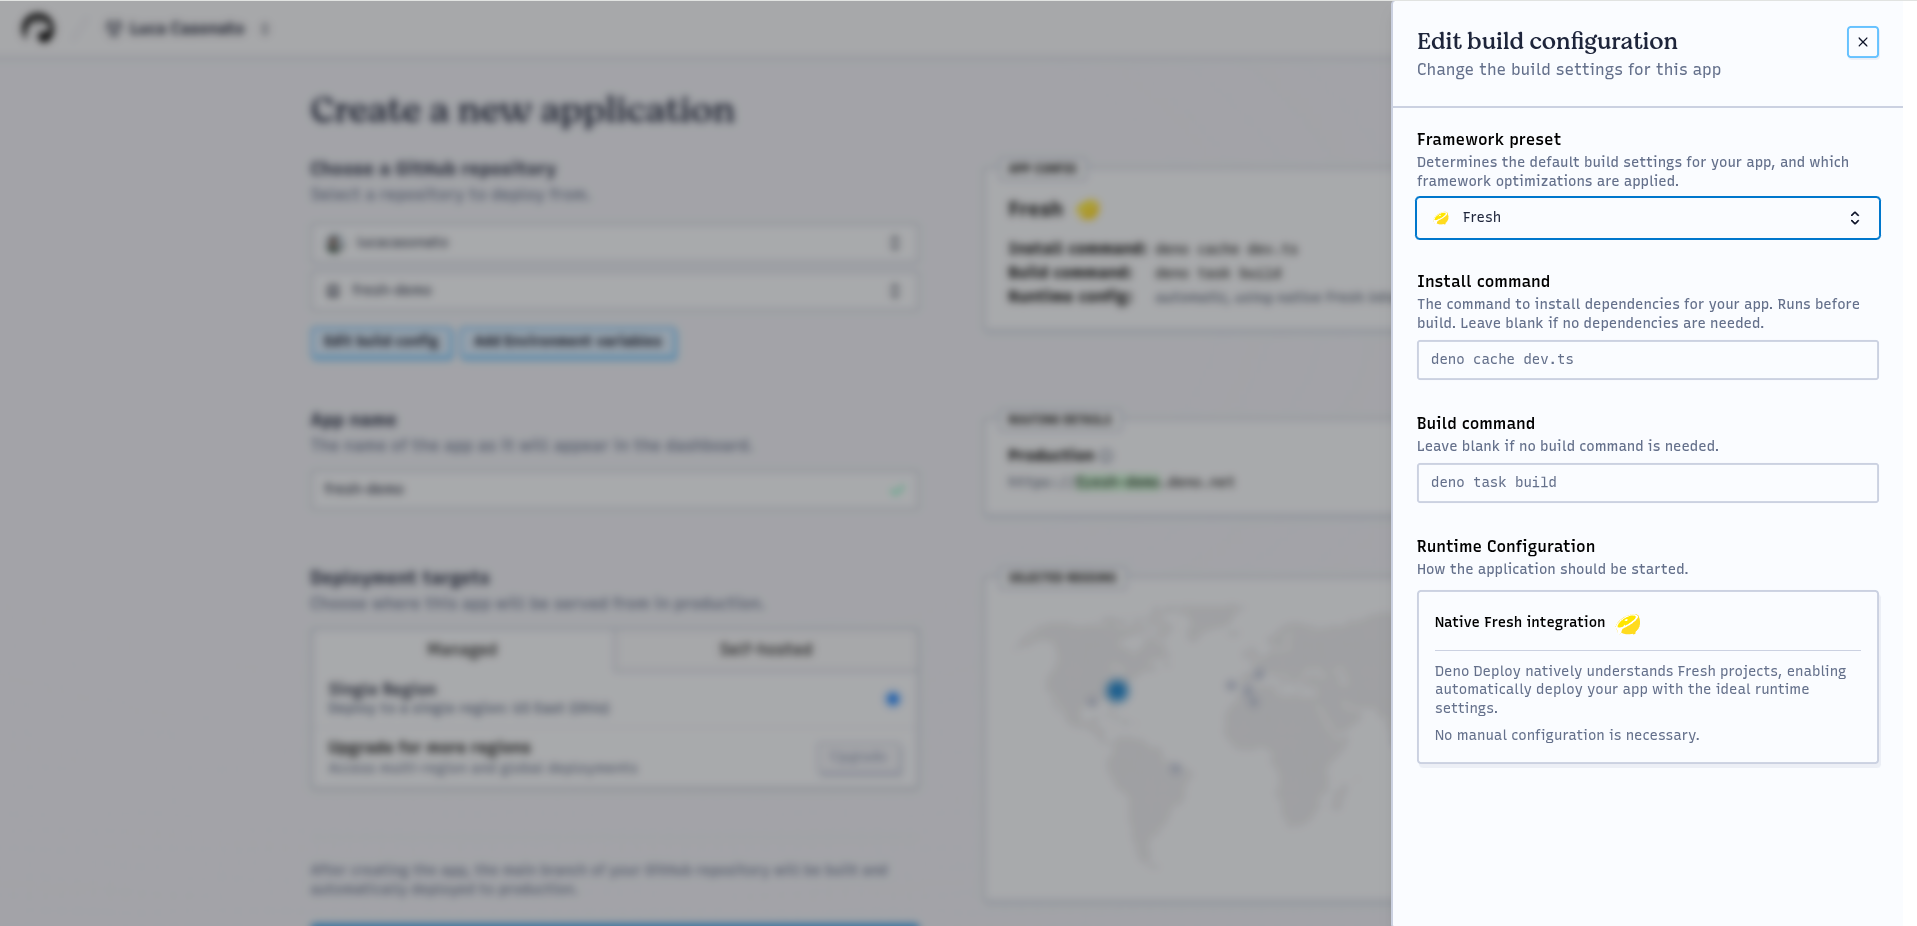
Configure your build Jump to heading
In the build config drawer, you can customize:
Framework preset Jump to heading
Select your framework or choose No Preset if using a custom setup.
Install command Jump to heading
Command for installing dependencies (e.g., npm install, deno install). This
can be empty for Deno applications without a package.json.
Build command Jump to heading
Command to compile/bundle your application (e.g., next build,
deno task build). Leave empty if your application doesn't require building.
Runtime configuration Jump to heading
For most frameworks there are no options to configure here, as Deno Deploy
EA will figure out the ideal runtime configuration for the app based
on the framework preset. When a framework is not configured, you can choose here
whether the app is a Dynamic app that needs to execute code server side for
every request, such as an API server, server-side rendered application, etc., or
a Static app that consists only of a set of static files that need to be
hosted.
Dynamic Entrypoint Jump to heading
The JavaScript or TypeScript file that should be executed to start the
application. This is the file path that you would pass locally to deno run or
node to start the app. The path has to be relative to the working directory.
Dynamic arguments Jump to heading
Additional command line arguments to pass to the app on startup, after the entrypoint. These are arguments that are passed to the application not to Deno itself.
Static Directory Jump to heading
The directory in the working directory that contains the static files to be
served. For example,dist,_site, or.output.
Single Page App mode Jump to heading
Whether the application is a single page app that should have the root
index.html served for any paths that do not exist as files in the static
directory, instead of a 404 page.
Closing the drawer saves the settings.
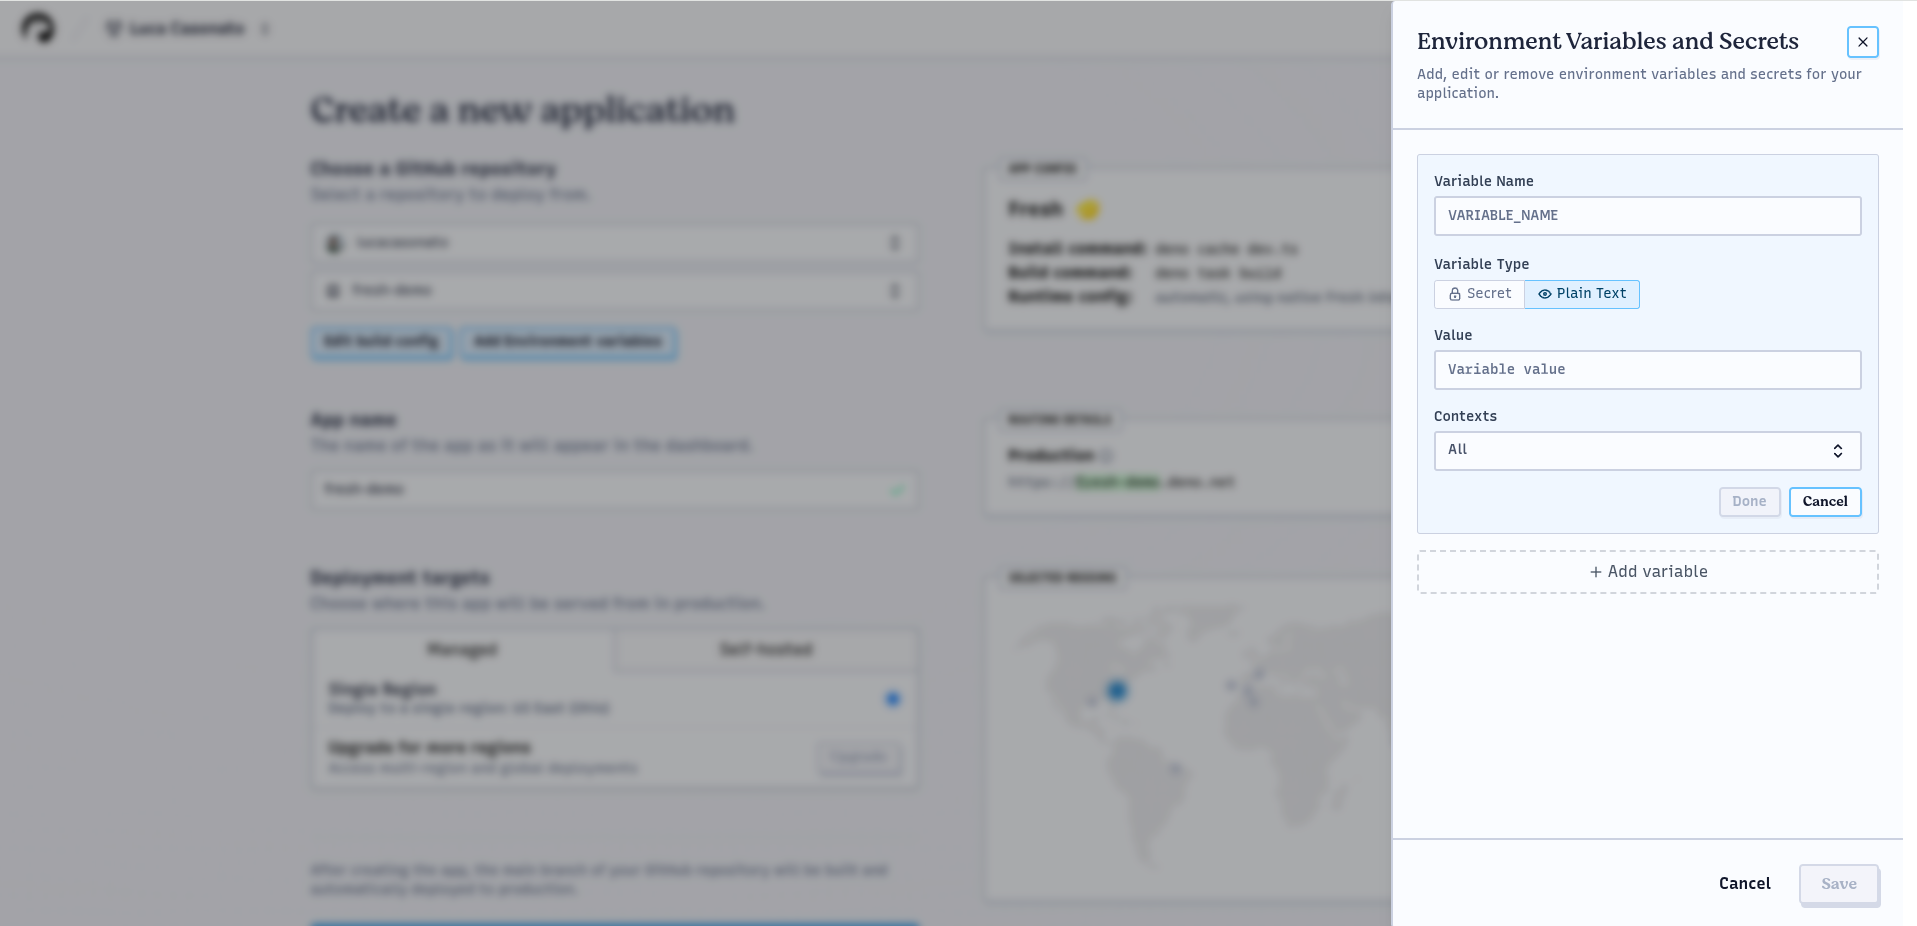
Environment variables Jump to heading
To add environment variables:
- Click
Add/Edit environment variables - Click
+ Add variablein the drawer - Enter the name and value
- Choose whether it's a plain text variable or secret
- Select the contexts where it should be available:
- Production: For requests to production domains
- Development: For requests to preview/branch domains
- Click
Saveto apply your changes
Build and deploy your app Jump to heading
- Click
Create Appto create the application and start the first build - Watch the build progress through the live logs:
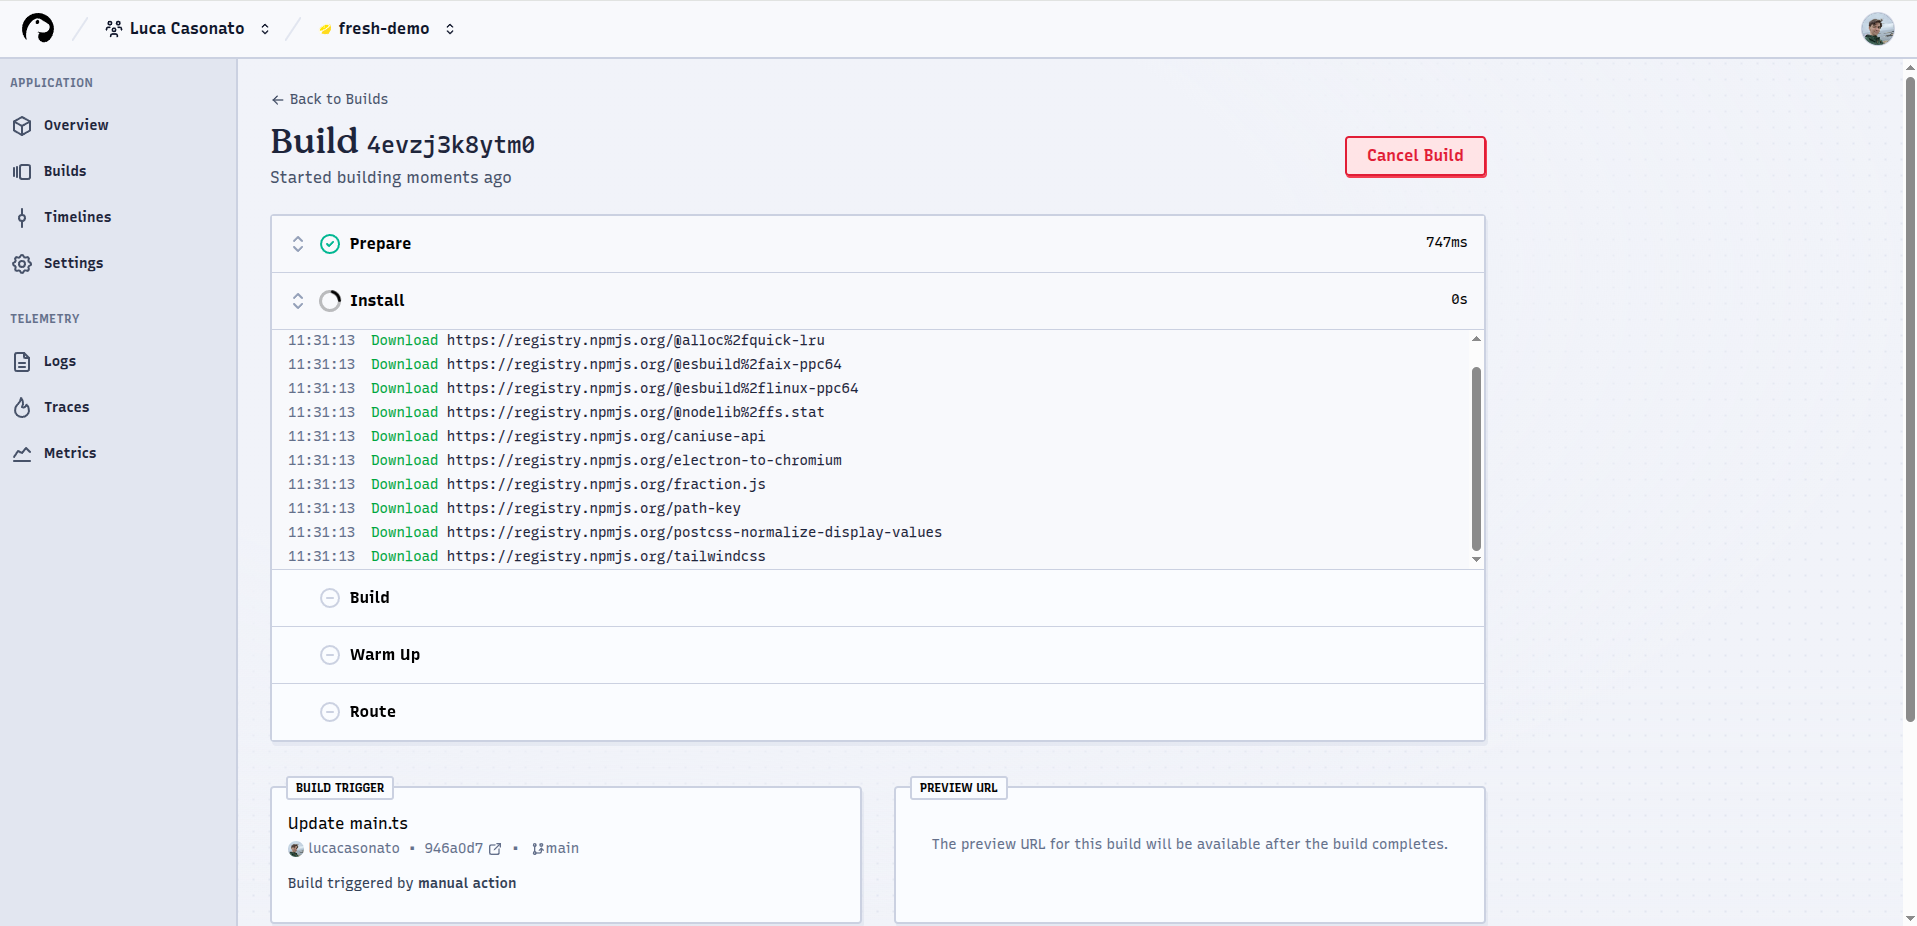
The build logs show these stages:
- Prepare: Cloning the repository and restoring caches
- Install: Running the install command and framework-specific setup
- Build: Executing the build command and preparing the deployment artifact
- Warm up: Testing the deployment with a request
- Route: Deploying the build to global regions
You can cancel a build with the button in the top-left corner, or restart failed builds from the same location.
After completion, the top-right shows the preview URL, and below that, all timelines where the build is deployed.
Monitor your application Jump to heading
After deploying, use the observability tools to monitor your application:
Logs Jump to heading
View application logs with filtering options for context, revision, and text content:
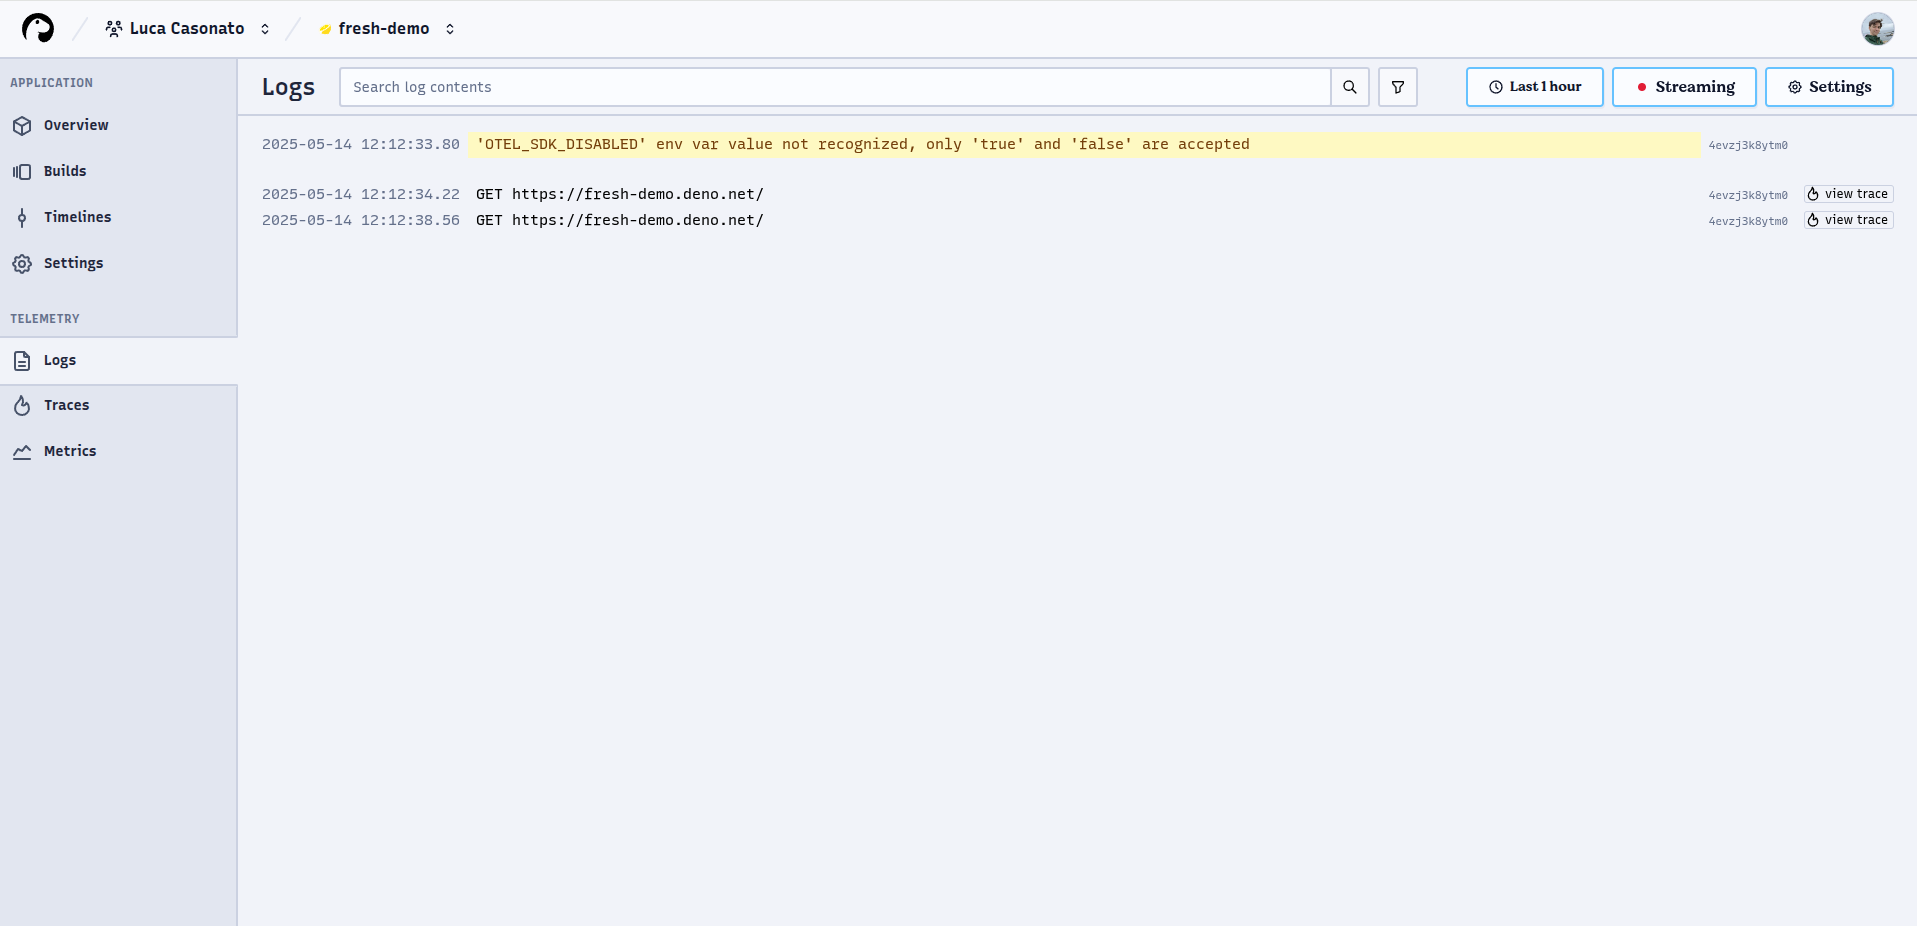
Use the search bar to filter logs (e.g., context:production, revision:<id>).
The time picker adjusts the displayed time range.
If a log is associated with a trace, you can click "View trace" to see the corresponding trace information.
Traces Jump to heading
View request traces with detailed timing information:
Click any trace to open the trace view showing all spans in a waterfall visualization:
The trace view shows:
- Timeline of spans with duration
- Span details including attributes
- Logs emitted during the span To save the environment variables, press the save button. You can re-open the drawer to edit / remove environment variables you have added.
You can also edit the app name on this page, and select which region(s) the application should be served from.
Build and deploy your app Jump to heading
Finally, you can press the Create App button to create the app. This will
create the app and immediately trigger the first build:
On the build page you can see live streaming build logs split into multiple sections:
- Prepare: cloning the GitHub repository and restoring build cache
- Install: executing the install command, and any framework specific pre-install setup
- Build: executing the build command, any framework specific pre- and post-build setup, and preparing the build artifact for deployment
- Warm up: sending a request to the preview URL of the deployment to ensure it starts up correctly. The logs shown in the Warm up section are Runtime logs, not build logs.
- Route: Deno Deploy is rolling out the new version of this build into all global regions.
In the top left of this build is a button to cancel the build. For failed builds, there is also a button to restart the build.
For completed builds, the top right shows the preview URL of the build. Further
down all timelines that this build is deployed to are shown, such as
Production, or Git Branch timelines.
You can also see how the build was triggered on this page. This can either be
manual action, for builds triggered through the UI, or GitHub repo for
builds triggered through the GitHub integration.
You can view the application through either the preview URL, or any of the other URLs shown in the timelines list.
Monitor your application Jump to heading
After visiting your application, you can view telemetry about your application in the form of the logs and traces available in our observability panels. You can visit these pages by clicking the respective buttons in the left sidebar.
Logs Jump to heading
The logs page shows all recent logs in the project. By default logs from all
contexts (production and development) are shown, but using the filter button and
search bar at the top, the shown logs can be restricted. For example, to filter
to only production logs, add context:production to the search bar. To only
show logs from a certain revision, use revision:<id> etc.
You can also use full text search in the search bar. The full text search fill filter down the log entries to only those containing the text written, case-insensitively.
By default logs from the last hour are shown. The time picker in the top right can be used to adjust the time frame that logs are shown for. The time zone of the timestamps shown is the time zone set in the time picker.
The "view trace" button on the right of a log line shows up if a log line is correlated with a trace. This happens when a log line occurs within an active trace. Clicking this button will open the respective trace as an overlay.
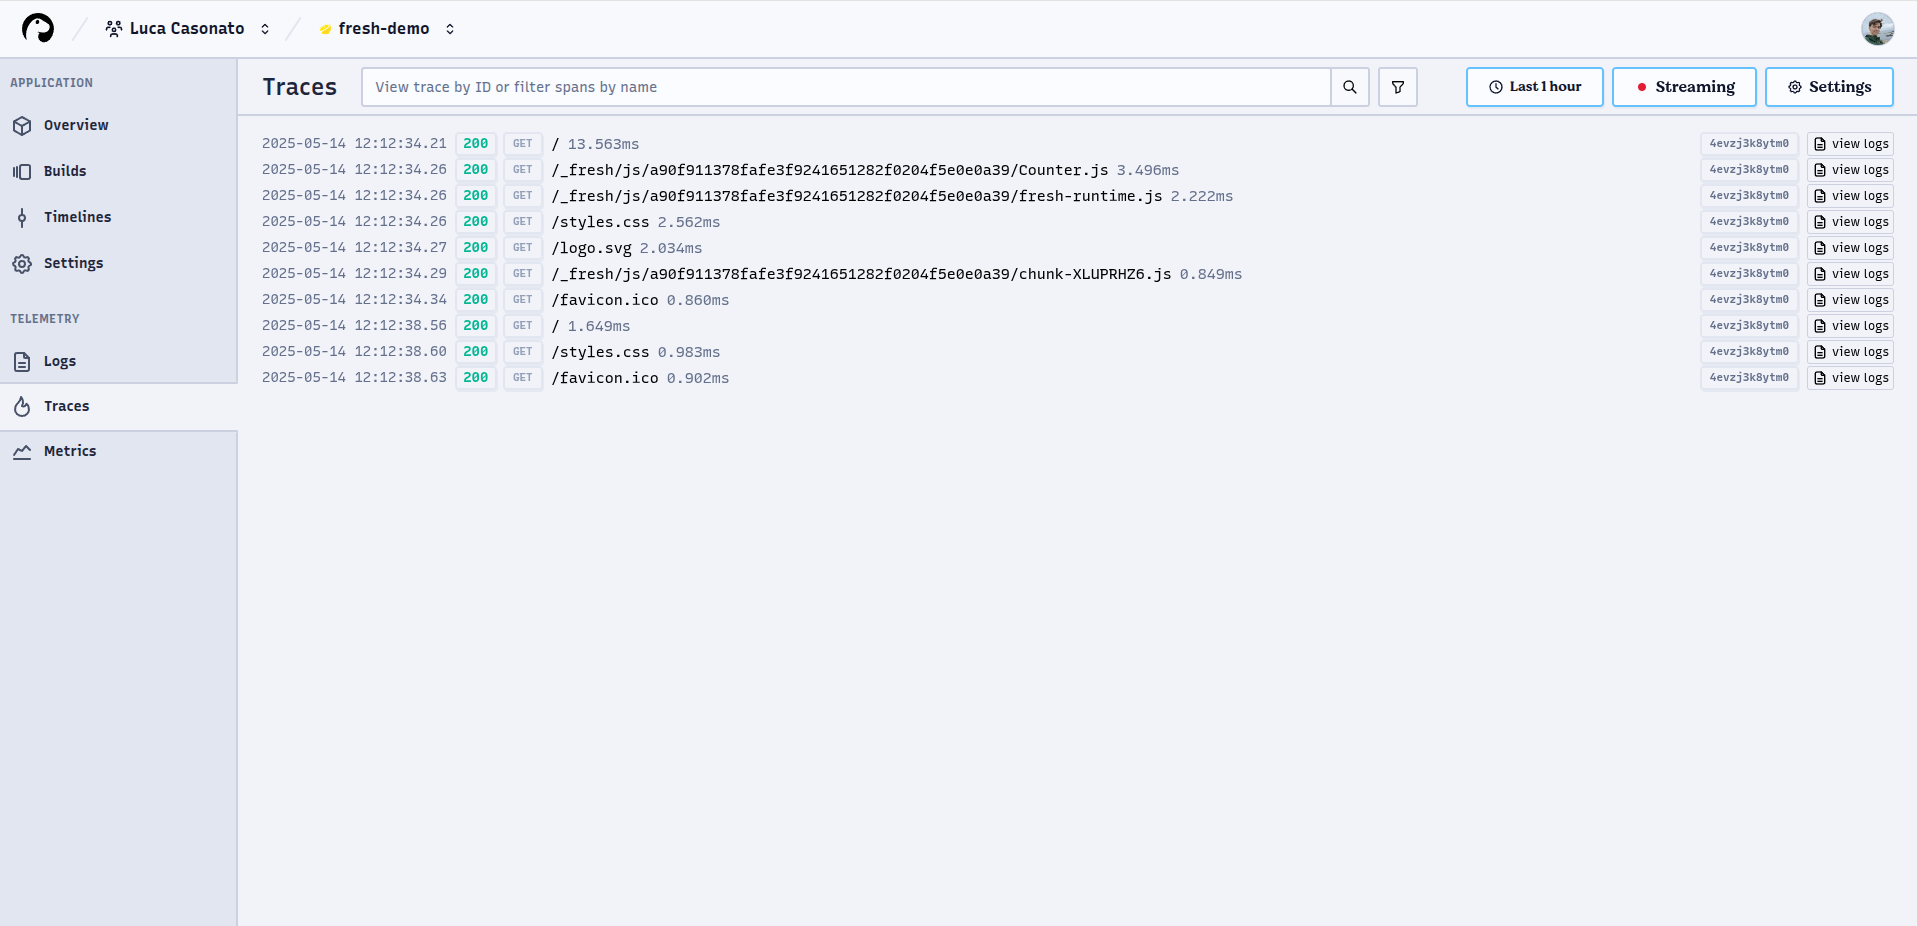
Traces Jump to heading
The traces page shows all recent traces in the project. By default traces from
all contexts (production and development) are shown, but using the filter button
and search bar at the top, the shown traces can be restricted. For example, to
filter to only production traces, add context:production to the search bar. To
only show traces from a certain revision, use revision:<id> etc.
All traces that contain an incoming HTTP request are shown in the list. The text shown for each trace is the path of the request, and the duration of the trace in milliseconds.
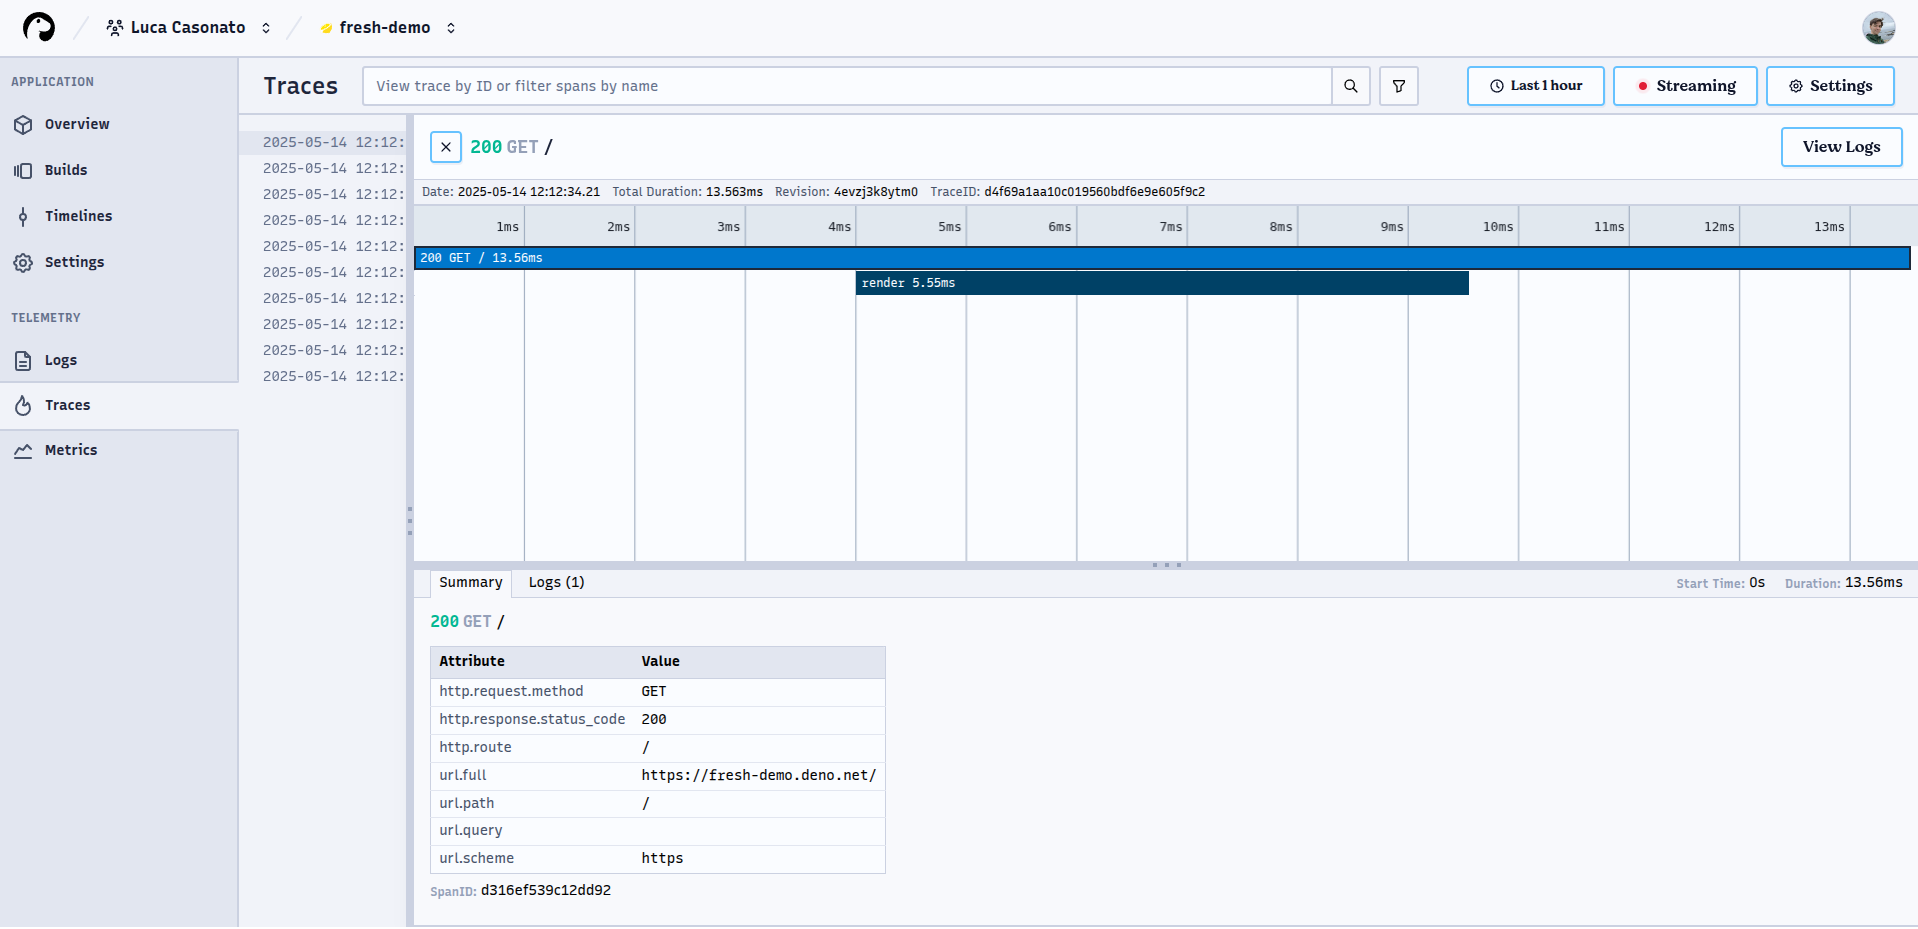
Clicking on a trace will open the trace view, which shows the full trace including all spans and logs that are part of the trace.
For each span in the trace you can see the duration of the span, the name of the span, the start and end time, and the recorded attributes. By clicking on a span in the timeline, the details of that span will be shown in the summary panel at the bottom.
The logs that are emitted as part of a given span are shown in the logs tab at the bottom. Changing the selected span will update which logs are shown in this panel.